
DB US Dollar Bullish PowerShares UUP ETF
Key Statistics (as of close 11/2/17)
Daily High 24.65 Short-Term Trend Bullish
Daily Low 24.55 Intermediate-Term Trend Bullish
Daily Close 24.63 Long-Term Trend Bullish
Minor Support Level 23.74 Minor Resistance Level 24.96
Major Support Level 21.07 Major Resistance Level 26.83
Minor Buy Signal 25.11 Minor Sell Signal 23.66
Major Buy Signal 27.19 Major Sell Signal 20.84
SHORT-TERM VIEW
Without question, one of the most important indicators in determining the future direction of stocks, bonds, precious metals & commodities, is the value of the US Dollar. The Dollar plays a huge role throughout the global economy in terms of international trade and capital flows between countries. For better or worse, the US Dollar is the global reserve currency. The vast majority of trading of goods & services between countries is priced in US Dollars. Consequently, all industrialized countries are influenced by the value of the Dollar.
In February 2007, Invesco Ltd introduced a PowerShares UUP ETF for tracking the performance of the US Dollar against a basket of six major currencies. The list includes the Euro, Japanese Yen, British Pound, Canadian Dollar, Swiss Franc & Swedish Krona. The ETF trades under the ticker symbol UUP.
UUP recorded an important top @ 26.83 on the very first trading day of 2017. The ETF declined relentlessly for the next nine months, as the US Dollar fell against all major currencies.
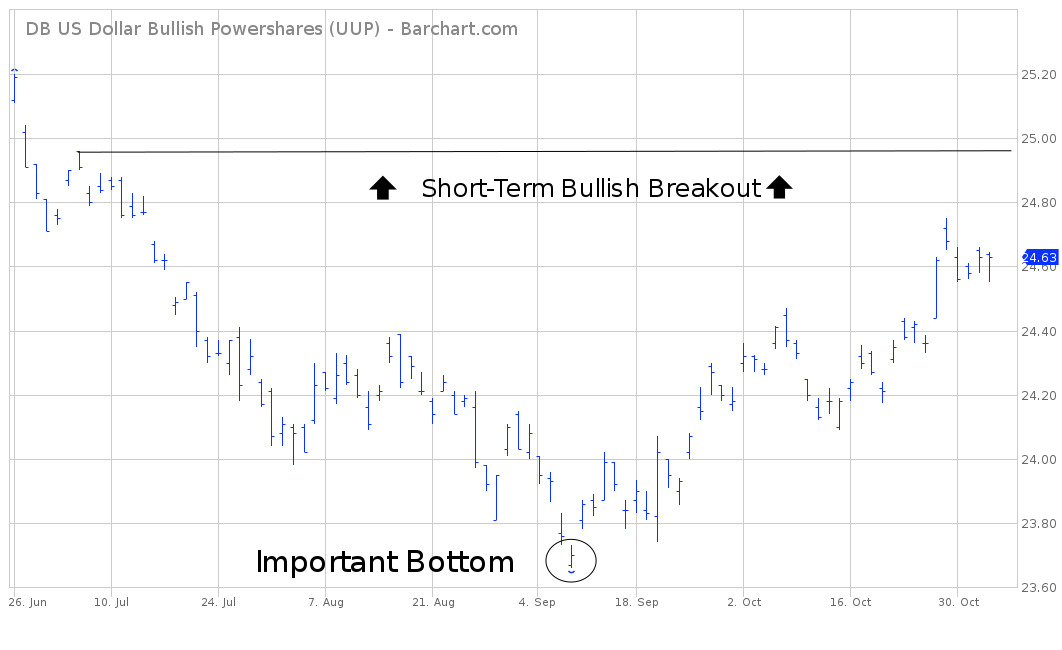
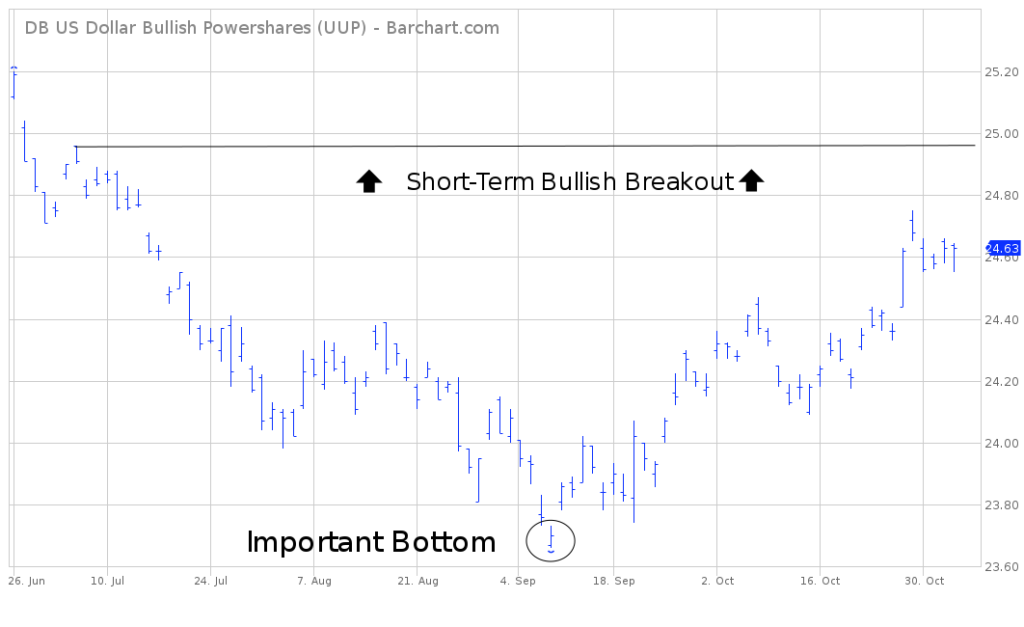
The brutal decline finally ended on September 8th @ 23.66. UUP has enjoyed a strong rally during the past seven weeks. In fact, the bulls have recaptured the momentum. All three of the trend following momentum indicators are bullish.
The next important resistance level for the bulls is 24.96. The bears can regain the upper hand by generating a weekly close below 23.74. The most likely scenario over the course of the next few weeks is a trading range, as UUP consolidates its recent advance.
Based on the Aroon Oscillator, UUP is hovering in slightly overbought territory with a reading of 40. The oscillator fluctuates between -100 and +100. A reading of 0 would indicate a neutral position. UUP could easily generate another leg to the upside before it becomes extremely overbought.
LONG-TERM VIEW
The long-term view of UUP is rather neutral. The ETF is basically trading in the middle of its ten year trading range of 20.84 to 27.19. The next “big move” could go in either direction.
Based on the fact that the US Dollar is such an influential component of all major asset classes,
investors are heavily focused on determining the direction of the next long-term movement of the Dollar, which will impact the price of UUP.
In terms of current market conditions, the US Dollar is trading in a fairly neutral territory. Therefore, the bulls and the bears are evenly matched. Let’s examine the bullish case and the bearish case for the US Dollar.
A bullish argument for the US Dollar always begins with the fact that the Dollar is the global reserve currency. As a result, there will consistently be a strong demand for the greenback on a global basis.
Another bullish factor for the Dollar involves global interest rates. Currently, the United States offers a much higher interest rate on its government bonds versus other G20 countries. As a result, the demand for US Dollars increases as global investors purchase US Treasury Bonds.
In addition to rising interest rates, the United States is also leading other countries in economic growth and inflation. Both of these factors (economic growth & inflation) are bullish for the Dollar. Without question, a strong case can be built in favor of a bullish outcome for the US Dollar over the course of the next few years.
Of course, the bears can also produce a strong argument for a long-term decline of the US Dollar. The Dollar bears agree that the greenback is the global reserve currency. However, the US Dollar reached its peak several years ago in regards to international trade. There is less trade conducted in US Dollars today versus 20 years ago. Certainly, the Dollar still remains the lead currency in global trade by a wide margin. Nevertheless, the trend is slowly moving away from the US Dollar in favor of other global currencies.
The bears certainly concede that interest rates are higher in the United States, which is probably short-term bullish for the Dollar. However, they contend that the current level of interest rates is not the most important factor. Instead, the overriding factor is the interest rate cycle. For example, the Federal Reserve began raising interest rates in December 2015. The Fed has been in a tightening cycle for almost two years. Therefore, the Fed is much closer to the end of its cycle versus other central banks. In fact, the European Central Bank (ECB) has been lowering interest rates for six consecutive years. They have not even begun to raise rates. The same circumstances exist with the Japanese Yen & Swiss Franc.
As a general rule, investors make their investment decisions based on economic conditions 12 to 18 months into the future. They don’t invest based on today’s outlook. Instead, they are always looking into the future. Consequently, investors in the US Dollar can plainly see that the interest rate spread between the United States and other countries will begin to narrow rather dramatically within the next 12 to 18 months. As countries close the interest rate gap with the United States, the value of the Dollar will drift lower. Interest rates may be helping the Dollar today, but certainly not in the future.
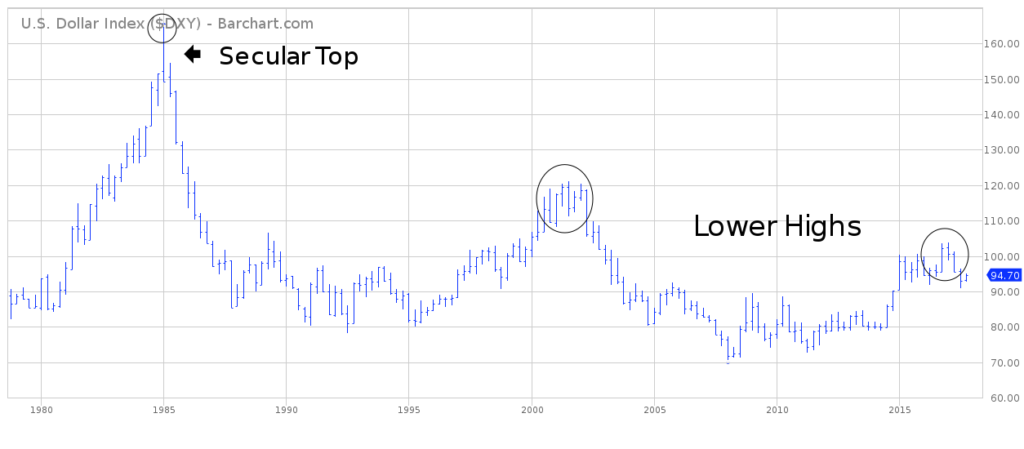
In addition to bearish fundamentals, the Dollar bears can also point to a rather negative technical outlook in terms of the greenback’s long-term chart pattern. It certainly appears the US Dollar formed a secular peak in February 1985. During the past 30+ years, the Dollar has been unable to exceed its 1985 high. This is “bad news” if you happen to be a long-term Dollar bull.
If we closely examine all of the data, the bears appear to have a stronger argument concerning the future long-term direction of the US Dollar. Several currency analysts from the “doom & gloom” crowd have been forecasting a complete collapse of the Dollar for the past several years. This type of scenario is highly unlikely. Instead, the most likely outcome is a long-term trading range with a slight bias to the downside.
The important numbers to watch for UUP are 21.07 & 26.83. A weekly close below 21.07 would push the long-term direction in favor of the bears. Conversely, a weekly close above 26.83 would be quite bullish from a long-term perspective. Currently, UUP is trading directly in the middle of these two numbers. Therefore, the next important breakout could go in either direction.
SHORT-TERM CHART
Please review the attached 6-month chart of UUP. An important bottom was recorded on September 8th. The bulls have recaptured the short-term momentum. Many traders have argued that the recent advance is nothing more than a “dead cat bounce” in an oversold market. This could be true. However, a weekly close above 24.96 would definitely solidify the bulls position. In order to regain the downside momentum, the bears need a weekly close below 23.74.
LONG-TERM CHART
Given the fact that UUP has only been in existence since 2007, let’s review a 40-year chart of the US Dollar Index. By all accounts, one could easily argue that the US Dollar formed a massive secular top in 1985. Subsequent rallies during the past 40 years have failed to exceed the high from 1985. In fact, the rallies have never even come close to the 1985 peak. At least for now, the bears can build a good argument for lower prices in the US Dollar as well as UUP.


