SPDR S&P 500 ETF (SPY)
Key Statistics
Minor Support Level 231.61 Minor Resistance Level 281.15
Major Support Level 107.43 Major Resistance Level 293.94
Minor Buy Signal 286.91 Minor Sell Signal 226.32
Major Buy Signal 308.83 Major Sell Signal 99.57
BRIEF OVERVIEW – S&P 500 ETF SPY
It’s official. Based on the S&P 500, stocks have entered a bear market. The vast majority of Wall Street professionals and licensed financial advisors agree that a 20% decline marks the beginning of a bear market. Therefore, the multi-year bull market officially ended on 24 December, when the S&P 500 penetrated 2352. Where do we go from here? Is this the beginning of a long-term secular bear market? Will the stock market struggle for the next ten years? Let’s review the details. A good place to start is by examining the most popular stock market averages. Please review the following table.
Stock Market Averages
Index Recent High Recent Low % Change
DJIA 26951.81 21792.20 (19.14%)
S&P 500 2940.91 2351.10 (20.05%)
Wilshire 5000 30331.75 24080.20 (20.61%)
Nasdaq Composite 8133.30 6190.17 (23.89%)
Russell 2000 1740.75 1266.92 (27.22%)
Source Barchart
As you can see, all of the major averages have suffered brutal declines during the past few months. So far, the Dow has managed to avoid a 20% decline. However, it’s only a matter of time before the Dow joins the other indices in bear market territory. It’s worth noting that the Dow is still enjoying the longest bull market in the history of Wall Street. The uninterrupted bull market has lasted 117 consecutive months. Most likely, the streak will be broken within the next few weeks.
In regard to the S&P 500, this represents the worst decline since the bear market of 2008 and 2009. Many Wall Street professionals claim the S&P is in the very early stages of a multi-year bear market, which will continue well into the 2020s. Other investors believe the recent decline is nothing more than a nasty correction in a secular bull market. The answer will be probably be revealed within the next few months.
The SPDR family of exchange traded funds introduced the S&P 500 ETF on January 22, 1993.
The ticker symbol is SPY. The ETF allows investors to participate in the S&P 500 without the burden of owning shares of each company within the index. SPY is historically significant because it was the very first exchange traded fund listed in the United States. SPY is easily the most heavily traded ETF, with daily volume usually exceeding 100 million shares.
SHORT-TERM VIEW – S&P 500 ETF SPY
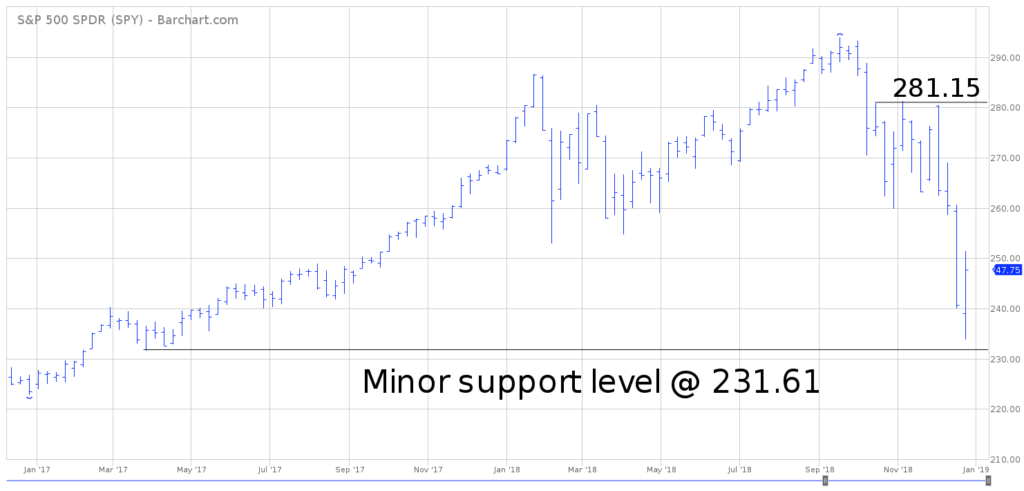
In regard to the short-term view of SPY, the bears are in complete control. The next important support level is 231.61. In order to recapture the momentum, the bulls need a weekly close above 281.15. For now, the path of least resistance is to the downside. The bulls could have a very difficult time regaining the momentum.
Based on the Aroon Oscillator, SPY has an extremely overbought reading of +84. The Aroon Oscillator is programmed differently than most stochastic indicators. The oscillator fluctuates between -100 and +100. A reading of 0 would indicate a neutral position. Therefore, a reading of +84 with SPY is considered aggressively overbought. Actually, this is a bad sign for the bulls. SPY has fallen rather sharply during the past ten weeks. However, the Aroon Oscillator remains in overbought territory. Therefore, SPY could generate a substantial decline before the oscillator becomes oversold.
LONG-TERM VIEW – S&P 500 ETF SPY
Given the recent decline, the “doom and gloom” crowd is out in full force predicting a stock market meltdown of 40% to 60%, along with a multi-year bear market. Of course, this same group has been forecasting a stock market meltdown for the past 5 to 7 years. They have been chronically wrong for the past several years. Will the perma-bears finally be vindicated? It’s much too early to know for sure. However, based on historical research, the likelihood of a long-term bear market appears to be rather remote. Please review the following tables.
Stock Market Corrections
1929 – 1953
Time Period # of Days % Decline
1930 – 1932 783 Days (83.0%)
1932 – 1933 173 Days (40.6%)
1933 95 Days (29.8%)
1934 – 1935 401 Days (31.8%)
1936 23 Days (12.8%)
1937 – 1938 390 Days (54.5%)
1938 – 1939 150 Days (26.2%)
1939 – 1940 229 Days (31.9%)
1940 – 1942 535 Days (34.5%)
1943 138 Days (13.1%)
1946 133 Days (26.6%)
1947 97 Days (14.7%)
1947 – 1948 205 Days (14.1%)
1948 – 1949 363 Days (20.6%)
1950 35 Days (14.0%)
1953 252 Days (14.8%)
Source Yardeni Research, Inc
Stock Market Corrections
1955 – 1974
Time Period # of Days % Decline
1955 18 Days (10.6%)
1956 – 1957 194 Days (14.8%)
1957 99 Days (20.7%)
1959 – 1960 422 Days (13.6%)
1962 174 Days (26.4%)
1962 62 Days (10.5%)
1965 46 Days (9.6%)
1966 240 Days (22.2%)
1940 – 1942 535 Days (34.5%)
1943 138 Days (13.1%)
1946 133 Days (26.6%)
1967 – 1968 162 Days (10.1%)
1968 – 1969 543 Days (36.1%)
1971 103 Days (10.7%)
1971 76 Days (11.0%)
1973 – 1974 630 Days (48.2%)
Source Yardeni Research, Inc
Stock Market Corrections
1974 – 1999
Time Period # of Days % Decline
1974 29 Days (13.6%)
1975 63 Days (14.1%)
1976 – 1978 531 Days (19.4%)
1978 63 Days (13.6%)
1979 33 Days (10.2%)
1980 43 Days (17.1%)
1980 – 1981 622 Days (27.1%)
1983 – 1984 288 Days (14.4%)
1987 101 Days (33.5%)
1990 28 Days (10.2%)
1990 87 Days (19.9%)
1994 61 Days (8.9%)
1997 52 Days (9.6%)
1997 20 Days (10.8%)
1998 45 Days (19.3%)
1999 91 Days (12.1%)
Source Yardeni Research, Inc
Stock Market Corrections
1999 – 2018
Time Period # of Days % Decline
2000 – 2002 929 Days (49.1%)
2002 – 2003 104 Days (14.7%)
2004 183 Days (8.2%)
2008 – 2009 517 Days (56.8%)
2010 70 Days (16.0%)
2011 157 Days (19.4%)
2011 28 Days (9.8%)
2012 60 Days (9.9%)
2012 62 Days (7.7%)
2013 34 Days (5.8%)
2014 19 Days (5.8%)
2014 28 Days (7.4%)
2015 96 Days (12.4%)
2015 – 2016 100 Days (13.3%)
2018 13 Days (10.2%)
2018 92 Days (17.5%)
Source Yardeni Research, Inc
These tables are filled with extremely valuable information. Yardeni Research compiled a list of every stock market correction (greater than 5%) dating back to 1929. The data clearly indicate that the behavior of the stock market changed rather noticeably following the “Black Monday” stock market crash of 1987. Prior to 1987, stock market corrections were much longer in duration and significantly larger in magnitude. What happened to the stock market following the crash of ’87? Why do stock indices behave differently today in comparison to 30 and 40 years ago?
The answer to these questions can be summed up in one word: “manipulation.” Following the crash of 1987, President Reagan (along with guidance from the Treasury Department, the Federal Reserve and the SEC), created the Working Group on Financial Markets. Throughout Wall Street, the group is colloquially known as the “Plunge Protection Team.” The majority of the Wall Street community simply refer to the group as “PPT.”
PPT was originally created to provide financial recommendations during periods of extreme volatility in the stock market and bond market. However, the overwhelming majority of investment professionals believe that the PPT is used to push the financial markets higher during periods of extreme weakness. In other words, they manipulate the stock market.
Upon reviewing the data from Yardeni Research, it certainly appears that the PPT has dramatically reduced the frequency and duration of stock market corrections since Black Monday, 1987. In fact, there have only been two prolonged bear markets during the past 31 years. 91% of the stock market corrections since 1987 have been short-lived and very well contained in regard to percentage moves. In other words, the Plunge Protection Team has done an extraordinary job of preventing nasty declines in the financial markets. In a nutshell, the PPT is manipulating the stock market in order to minimize the number of bear markets.
Please review the stock market corrections prior to 1987. From 1929 through 1986, the stock market experienced a number of declines in excess of 100 days. Since the crash of 1987, there have only been five stock market declines in excess of 100 days. Obviously, the PPT has been very successful in their attempt to “manage” the stock market.
Admittedly, the Plunge Protection Team can’t prevent all bear markets. They were unable to stop the dotcom disaster in the early 2000s. Additionally, PPT could not avert the 2008 financial crisis. In fact, many experts agree that the PPT actually allowed the financial crisis to occur in an effort to minimize excessive speculation. Whatever the case may be, PPT certainly helped lay the groundwork for an incredible stock market recovery following the 2008 crisis.
Upon reviewing the data from Yardeni Research, most investors will agree that the likelihood of a long-term bear market is rather remote. Of course, it is possible that the current stock market decline could morph into a brutal bear market. However, it’s rather unlikely.
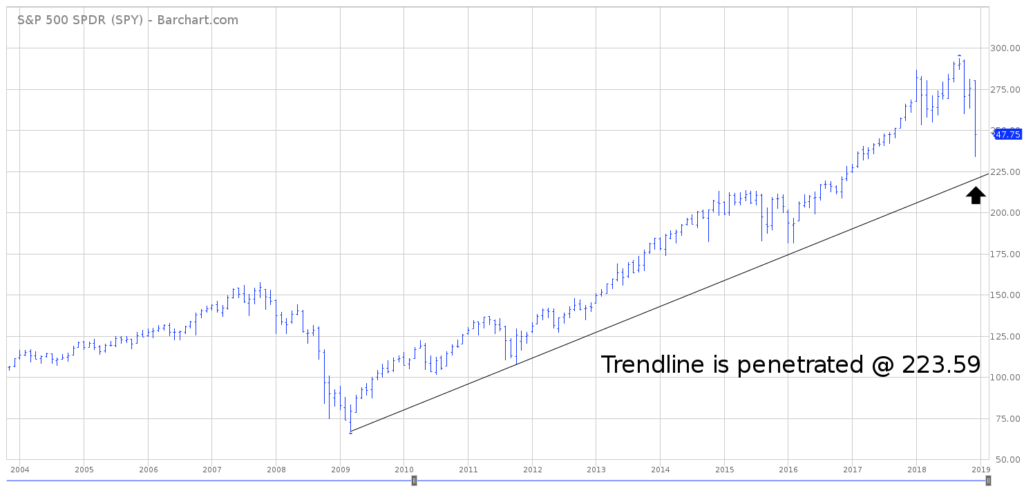
In regard to SPY, the long-term view is still bullish, despite the recent decline. The next level of resistance from a long-term perspective is 293.94. In order to capture the long-term momentum, the bears need a weekly close below 107.43.
SHORT-TERM CHART – S&P 500 ETF SPY
Please review the attached 24-month chart of SPY. The bears are in control of the short-term pattern. The next level of support is 231.61. A weekly close below 231.61 opens the door to 226.32. In order to reverse the bearish trend, the bulls need a weekly close above 281.15. Based on the current chart formation, the most likely scenario is a continuation of lower prices.
LONG-TERM CHART – S&P 500 ETF SPY
Please review the attached 15-year chart of SPY. The long-term chart pattern continues to remain very bullish. However, for the first time since March 2009, it does appear that SPY could be on the verge of rolling over in terms of its bullish chart pattern. The first sign of trouble would be a penetration of the bullish trend line @ 223.59. Officially, the long-term trend remains bullish until the ETF generates a weekly close below 107.43, which is highly unlikely any time in the near future.


