
SPDR S&P 500 ETF SPY
Key Statistics
Minor Support Level 255.63 Minor Resistance Level 280.23
Major Support Level 107.43 Major Resistance Level 304.62
Minor Buy Signal 281.84 Minor Sell Signal 254.00
Major Buy Signal 308.45 Major Sell Signal 101.13
BRIEF OVERVIEW – SPDR S&P 500 ETF SPY
Given the recent volatility in US equities, perhaps now is a good time to analyze the current state of the financial markets. Are we on the verge of another global economic meltdown? Is the stock market in the early phases of a long-term decline? Let’s review the current state of affairs in the financial universe.
Most financial historians will agree that the 2008 global financial crisis officially ended on March 9, 2009. This date marked the low in the S&P 500 @ 666.79. It’s been smooth sailing for the stock market over the course of the past nine years, with a few minor bumps along the way. In fact, we are in the midst of the second longest uninterrupted bull market in the history of the New York Stock Exchange. If the S&P 500 can avoid a 20% correction within the next five months, a new record will be established on July 9, 2018.
All major US stock indices recorded a new all-time high on January 26th. However, the equity markets have taken a nasty tumble during the past two weeks. In fact, as of February 8th, the S&P 500 was down 10.17% from its recent high. This could mark the beginning of a substantial decline that all of the “perma-bears” have been forecasting for the past few years. Or maybe not. The equity markets will provide us with a much clearer picture in a few weeks.
The SPDR family of exchange traded funds introduced the S&P 500 ETF on January 22, 1993. The ticker symbol is SPY. As the name implies, SPY tracks the performance of the S&P 500 stock index. This ETF is historically significant because it was the very first exchange traded fund listed in the United States. SPY is easily the most heavily traded ETF, with daily volume usually exceeding 100 million shares.
SHORT-TERM VIEW – SPDR S&P 500 ETF SPY
The recent brutal decline in SPY has turned the tide from bullish to bearish. For the first time in several months, the bears are in control of the short-term momentum. Based on historical patterns, when a market “flips” from bullish to bearish after a long period of moving in the same direction, the market will usually remain bearish for an extended period of time. Therefore, the bears could easily maintain control of SPY for the next several weeks.
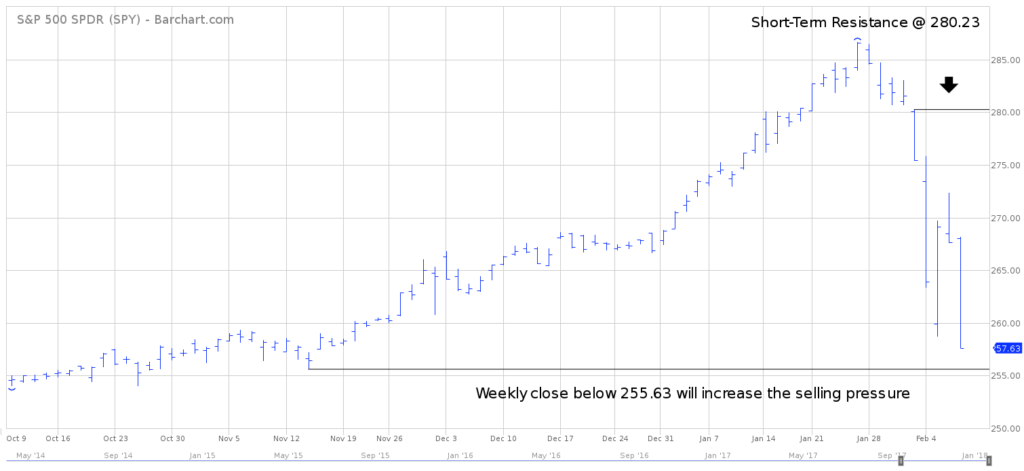
In order to recapture the bullish momentum, SPY must generate a weekly close above 280.23. The recent price action of the past two weeks would suggest that the bulls will have a difficult time pushing SPY above 280.23. The bulls have clearly lost control of this ETF.
LONG-TERM VIEW – SPDR S&P 500 ETF SPY
Are US equities on the verge of a new multi-year bear market? Will the perma-bears finally have their day in the sun? Of course, it’s virtually impossible to answer these questions with 100% accuracy. However, there are a few clues which can provide us with a “big picture” overview of the domestic stock market.
At first glance, it definitely appears that the stock market is overextended and probably due for a meaningful correction. In fact, a strong argument could be made that US stocks may have entered a parabolic advance during the past few months. Additionally, many of the popular valuation metrics used by the financial community have reached extreme levels based on historical measurements. Therefore, on the surface, the bearish camp has a great deal of ammunition to use against the stock market bulls.
Without question, the US stock market is rather frothy and overbought. However, the driving forces which have propelled the stock market higher since 2009 are still firmly in place. These forces include historically low interest rates, accommodative monetary policy and foreign participation in US equities. As long as these building blocks remain in place, it’s difficult to imagine the commencement of an extended bear market.
Many analysts in the Wall Street community are claiming that the building blocks are slowly beginning to crumble. For example, they point to the fact that interest rates are on the rise. The era of low interest rates is over and rising rates will become a headwind for the stock market. These analysts do have a good point. Indeed, interest rates (both long-term and short-term) have been creeping higher for the past several months. However, on a relative basis, interest rates are still incredibly low. Most likely, rates will stay below their historical average well into the future. Consequently, the stock market will easily accept higher interest rates as long as it occurs in moderation.
In addition to rising rates, some analysts contend that the Federal Reserve has switched its monetary policy from accommodative in favor of a more restrictive policy. This is definitely a true statement. The Fed has adopted a more hawkish monetary policy by raising the level ofshort-term interest rates three times during the past 12 months. At least for now, the stock market is not the least bit concerned because interest rates are still historically low. Admittedly, the Federal Reserve will continue to raise interest rates in 2018. However, it will occur slowly over an extended period of time.
Foreign participation in US equities continues to remain incredibly strong. In fact, foreign participation is at an all-time historic high. Through the first 11 months of 2017, foreign countries purchased $91.4 billion in US equities. Most likely, this pattern will continue well into 2018.
Clearly, the three main pillars holding up the stock market (interest rates, Federal Reserve & foreign purchases) are still on a solid foundation. Eventually, these trends will reverse and the stock market will enter a period of declining prices. Based on the price action in the stock market, the trend reversals will not occur for several more months.
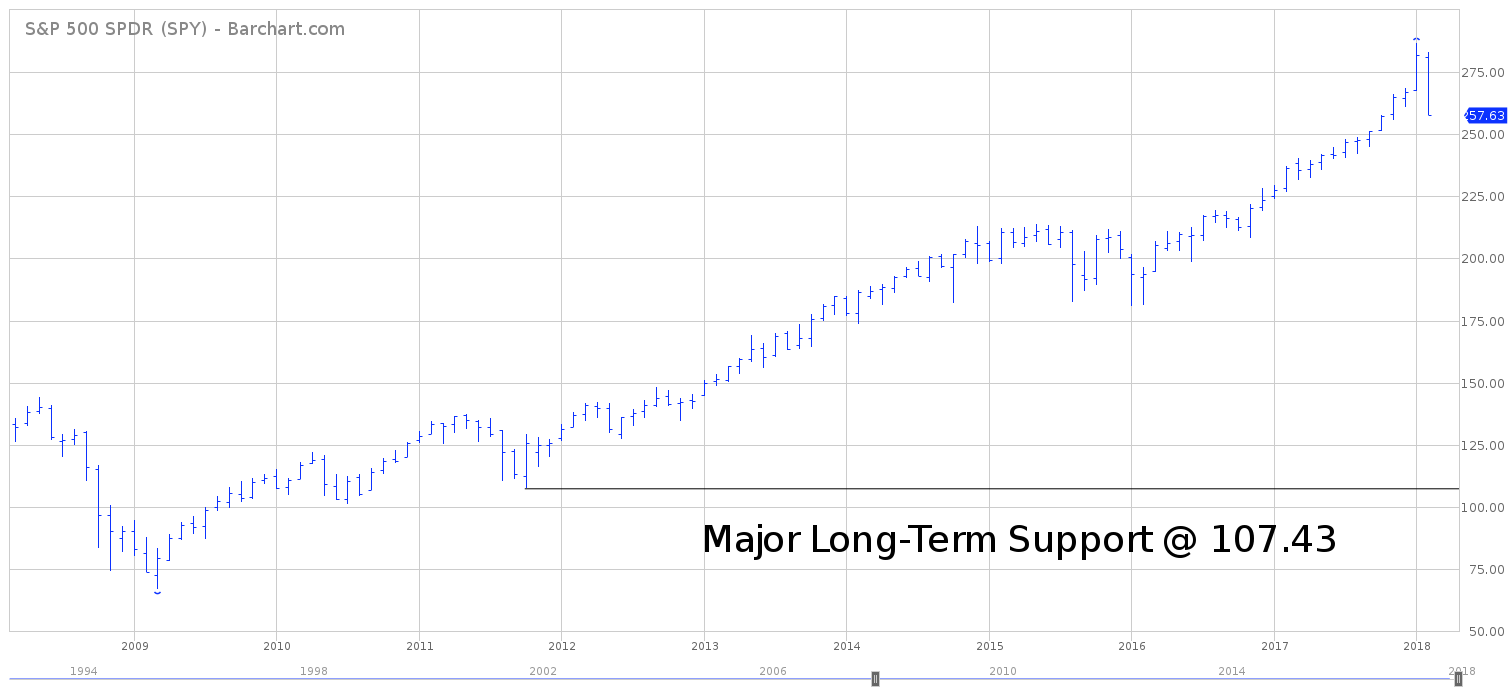
Despite the recent brutal decline in SPY, the long-term picture is still quite bullish. The momentum is definitely in favor of the bulls. The momentum would reverse on a weekly close below 107.43. However, this type of price decline appears highly unlikely any time in the near future. Of course, anything is possible.
SHORT-TERM CHART – SPDR S&P 500 ETF SPY
Please review the attached 4-month chart of SPY. It’s amazing how quickly a chart pattern can change from extremely bullish to extremely bearish. Two weeks ago, SPY was trading at an all-time historic high. Today, the ETF is hovering near its lowest level in three months (and probably headed lower).
For the past several months, the bulls have been in complete control of the short-term trend. However, the bears have recaptured the trend with a vengeance. The next important support level is 255.63. The selling pressure will intensify on a weekly close below 255.63.
The bulls need a weekly close above 280.23 in order to recapture the short-term trend. Based on the price action of the past few days, it’s rather improbable that SPY will trade above 280.23 as we move into February and March.
LONG-TERM CHART – SPDR S&P 500 ETF SPY
Please review the attached 10-year chart of SPY. The recent sharp decline is nothing more than a small blip on the chart. The bulls are easily in control of the long-term trend. A brief review of the current chart pattern would indicate a continuation of the bullish trend. The bears need a weekly close below 107.43 (highly unlikely any time in the near future).
2 Comments
Leave a Reply
You must be logged in to post a comment.


Since I have lost my password, is there any way I can get back in to your service?
You can just go here – the login page and click Forgot Password. Thanks.