SPDR Dow Jones Industrial Average ETF (DIA)
Key Statistics – DIA
Minor Support Level 259.94 Minor Resistance Level 285.79
Major Support Level 112.14 Major Resistance Level 304.68
Minor Buy Signal 292.36 Minor Sell Signal 255.35
Major Buy Signal 313.49 Major Sell Signal 101.33
BRIEF OVERVIEW – DIA
On 31 August, the components of the Dow Jones Industrial Average (DJIA) were changed in an effort to reflect the current state of the US economy. Since its initial launch in 1896, changes to the index have only occurred on 56 different occasions. The most recent change involved the addition of Salesforce.com, Amgen and Honeywell. The companies removed from the index included Exxon Mobile, Pfizer and Raytheon. The change was especially difficult for Exxon Mobile, which was originally added to DJIA in 1928. For the first time in 92 years, Exxon Mobile is no longer associated with the Dow Jones Industrial Average.
S&P Global, the owner of the DJIA, has done a remarkable job of selecting the appropriate companies to represent the transformation of the US economy during the past few decades. Even though DJIA is listed as an industrial stock index, only 23% of the companies within the index are industrial-based. The largest component of the index is represented by technology companies.
The removal of Exxon Mobile is a perfect indication of how the US economy has changed over the course of the past 25 years. In less than three decades, our nation has transformed itself into the most technology-dominant economy on the planet. Thanks to the internet mania of the late-1990s and the hi-tech revolution in Silicon Valley, the United States leads all countries in technological innovation. This includes areas such as artificial intelligence, robotics, DNA sequencing, fintech innovation, next generation internet, autonomous mobility and clean energy.
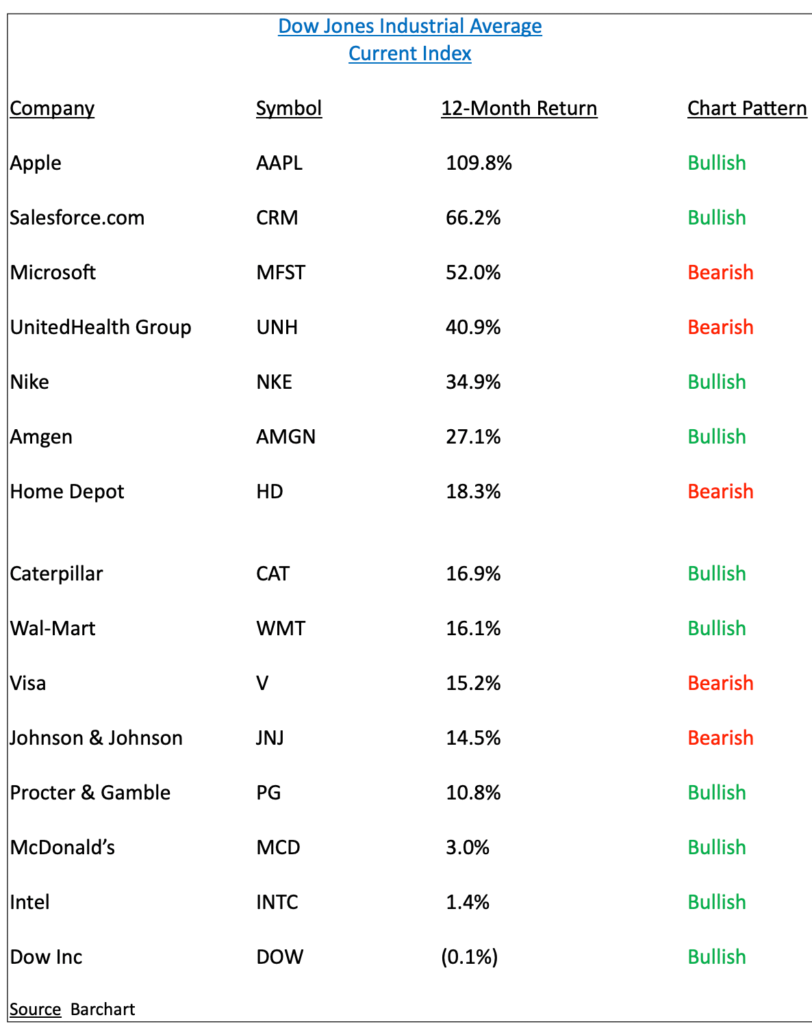
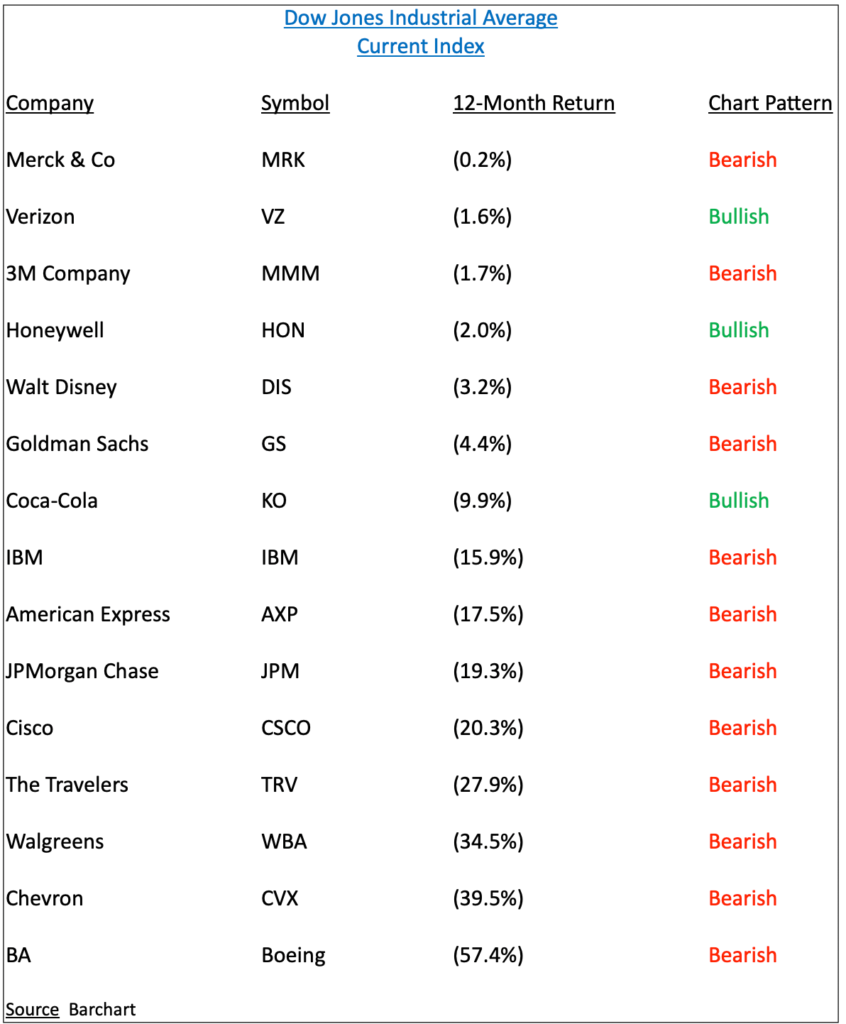
What can DJIA teach us about the current state of the domestic economy? If we examine the individual stocks inside the index, DJIA can show us which sectors of the economy have been most impacted by the global pandemic. Whether we like it or not, COVID-19 will permanently change the way consumers work, eat, travel, shop and educate themselves. Arguably, this pandemic will become the greatest disruptive force of the twenty-first century. Our lives will never return to pre-COVID levels. Consequently, this will create spectacular long-term investment opportunities. Let’s begin by examining the current performance of each stock located in DJIA. Please review the following tables.
As you can see from the list, the top three performing stocks are technology companies. In fact, Apple is arguably the most technologically robust company on the planet. Saleforce.com is the “new kid on the block.” Founded in 1999, CRM offers a proprietary mix of analytical software designed to help businesses manage their relationship with new and existing customers. Within its peer group, the company is routinely voted as the most innovative publicly traded company. Of course, Microsoft needs no introduction. MSFT will go down in the history books as a revolutionary trailblazer during our nation’s transition from an industrial-based economy to a technology-based economy.
The worst performing stocks are “old economy” dinosaurs from the industrial heyday of the 1960s and 1970s. Boeing has been manufacturing airplanes since its founding in 1916. Thanks to one of the largest mergers in US history, Chevron became the nation’s second largest energy company in 2000 when it combined forces with Texaco. Rounding out the three worst performing companies within the Dow Jones Index is Walgreens. At first glance, WBA does not appear to have anything in common with industrial-based companies like Chevron or Boeing. On the surface, WBA is certainly not a member of the industrial economy. However, Walgreens is similar to other poor performing companies within the Dow Jones Index because of its overvalued real estate holdings. Formed in 1901, Walgreens owns and operates 9,277 stores in the United States. The company’s “brick and mortar” business model is very unpopular among Wall Street professionals. This explains why WBA has performed so poorly during the past 52 weeks.
The SPDR family of exchange traded funds (managed by State Street Global Advisors) introduced the Dow Jones Industrial Average ETF on 14 January 1998. The ticker symbol is DIA. This ETF is a perfect vehicle for investors who wish to participate in the performance of DJIA. DIA is an extremely popular ETF, with an average daily volume of nearly six million shares. The ETF is commonly referred to as “Diamonds.”
SHORT-TERM VIEW – DIA
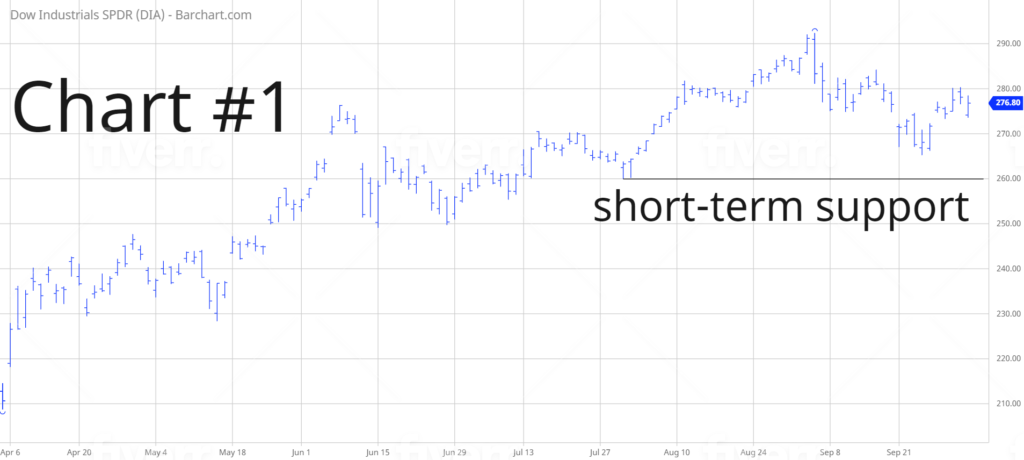
Despite the weak performance of several stocks within the Dow Jones Index, DIA remains in bullish territory on a short-term basis. The next level of resistance is 285.79. In order to recapture the momentum, the bears need a weekly close below 259.94. The most likely scenario is a continuation of higher prices.
LONG-TERM VIEW – DIA
Arguably, our nation is in the early stages of witnessing one of the greatest technological disruptions of the past 200 years. Thirty years from now, financial historians will regard the next three decades as a seminal shift in the way businesses and consumers interact with each other. All industries will be forced to undergo significant changes in the way they connect with their customers and their employees. Businesses that refuse to adapt will be left for dead. Thanks to the introduction of digital currencies and blockchain technology, this transformation process will be raised to a new level. Satoshi Nakamoto has permanently altered our nation’s working environment, socializing, shopping, entertainment, dining out, worshiping, education, etc. The list is endless.
Since its founding in 1776, the United States has witnessed four major periods of technological advancement. Let’s briefly review each time period.
Industrial Revolution (1760 – 1840)
Arguably, the Industrial Revolution was the most important turning point in the history of the global economy. It involved the transition to new manufacturing processes. More specifically, the Industrial Revolution was responsible for transiting from hand production methods to machines. It also included new types of chemical manufacturing, iron production processes, the development of machine tools and the beginning of the factory system.
Technological Revolution (1870 – 1914)
The Technological Revolution (also known as the Second Industrial Revolution) was characterized by a rapid period of industrialization from the late-1800s to the mid-1910s. The most notable development during this period of time was the building of the railroad network, primarily throughout Britain, Germany and the United States. Equally important was the expansion of telegraph lines along with the invention of the telephone and electrical power.
Digital Revolution (1977 – 2000)
The Digital Revolution (also known as the Third Industrial Revolution) officially began in 1977, with the introduction of home computers by Apple and Commodore. Essentially, the Digital Revolution represents the shift from mechanical technology to digital electronics. It is highlighted by the adoption and proliferation of digital computers and digital recordkeeping. Many historians believe that the Digital Revolution is still underway, thanks to the global adoption of mobile phones followed by smart phones. Other historians believe that the Digital Revolution ended with the peak of the internet mania in 2000.
Financial Revolution (2009 – present)
Fifty years from now, most financial historians will probably agree that the Digital Revolution ended with the popping of the dot com bubble in 2000. Why? Because it’s quite obvious that a new technology revolution was unleashed on 3 January 2009. This marks the date when Satoshi Nakamoto mined the first 50 Bitcoins into existence. Of course, it’s always difficult to describe a revolution when it’s occurring in real-time. It’s much easier to discuss the financial ramifications 30 years after the fact. However, we can form an educated guess on how the Financial Revolution will unfold. Most likely, the biggest takeaway from the Financial Revolution will be the dismantling of the legacy banking system. Traditional “brick and mortar” banks will slowly disappear over the course of the next few decades. Instead, they will be replaced by digital wallets attached to our mobile devices. This is just one example of the structural changes that will occur throughout the Financial Revolution.
As we discussed, S&P Global has adjusted DJIA during the past few years in an effort to reflect the changes that have been occurring throughout the domestic economic landscape. In all likelihood, this is just the tip of the iceberg. DJIA will experience several modifications during the next 20 to 30 years in order to maintain the integrity of the index. In 1928, the index was comprised of 30 stocks for the first time in its brief history. DJIA consisted of 93% industrial companies. Today, the number of industrial companies is only 23% of the index. As we mentioned, these industrial companies have been replaced by technology companies. The next big shakeup will probably involve the removal of legacy financial companies. These companies will be replaced by the leaders of the current financial revolution. This would include businesses involved in cryptocurrencies, blockchain technology, decentralized finance and digital assets. These “financial revolution” companies will create spectacular investment opportunities throughout the next few decades.
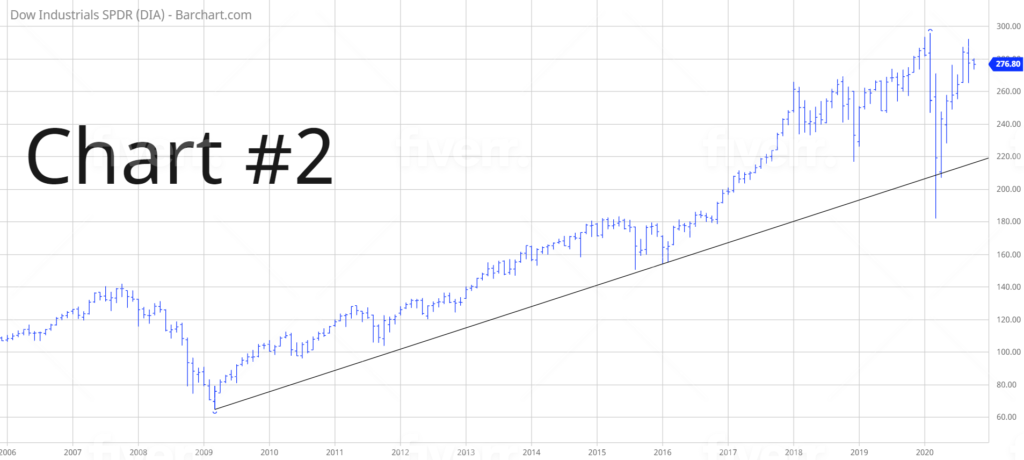
In regard to DIA, the long-term view remains extremely bullish. The next resistance level is 304.68. A
weekly close below 112.14 is needed in order to reverse the momentum. It’s highly unlikely that the long-term momentum will turn bearish any time in the near future.
SHORT-TERM TREND
Please review the 6-month chart of DIA (Chart #1). Despite the recent decline, the short-term chart pattern remains bullish. The next level of resistance is 285.79. The trend will remain bullish as long as DIA stays above 259.94 on a weekly closing basis. The most likely scenario is a continuation of higher prices.
LONG-TERM TREND
Please review the 15-year chart of DIA (Chart #2). The long-term bullish trendline was broken in March 2020. However, the trend remained bearish for less than 30 days. This is a testament to the incredible bullish nature of the stock market. A weekly close below 112.14 is needed in order to create a bearish chart pattern, which is highly unlikely.


