
SPDR S&P 500 ETF (SPY)
Key Statistics
Thank you for reading this post, don't forget to subscribe!Minor Support Level 256.60 Minor Resistance Level 280.41
Major Support Level 107.43 Major Resistance Level 304.62
Minor Buy Signal 281.84 Minor Sell Signal 254.67
Major Buy Signal 308.45 Major Sell Signal 101.13
BRIEF OVERVIEW – S&P 500 ETF SPY
Stock market investors can be divided into two main categories, individual investors and institutional investors. Without question, the most popular stock market index among individual investors is the Dow Jones Industrial Average, which is comprised of 30 different companies. This index has been in existence since 1896 and it is beloved by stock market enthusiasts all across the world.
In terms of institutional investors, the Standard & Poor’s 500 is the most widely followed index. More commonly known as the S&P 500, institutional investors use the index as a measuring device to compare their performance results against the performance of the S&P 500. Consequently, the index is critically important among the institutional crowd. In fact, the annual performance of the S&P 500 has been known to “make or break” the trading careers of many Wall Street professionals. In an effort to gain a better understanding of this important stock index, let’s take a closer look at the S&P 500.
Before we dive into the specific details, perhaps it would be a good idea to briefly discuss the role of an institutional investor. In a nutshell, an institutional investor is an organization that invests on behalf of its members. There are six types of institutional investors: hedge funds, commercial banks, pension funds, mutual funds, insurance companies and pension funds. If you own a mutual fund, your account is being managed by an institutional investor.
Institutional investors are easily the largest participants in the securities markets in terms of trading volume. They perform the majority of the trades on major exchanges and greatly influence the prices of securities. Without institutional investors, the financial markets would be extremely illiquid and inefficient.
Let’s return our focus to the S&P 500. The launch date for the S&P 500 was March 4, 1957. There were similar versions of the index prior to 1957. However, the index did not include 500 companies until March 4, 1957.
The S&P 500 is divided into 11 different sectors. Each sector is subdivided into various industries which are designed to provide a representation of the US economy. Please review the following tables.
S&P 500 Stock Market Index
Sectors And Industries
Sector Industry
Consumer Discretionary Auto Components
Consumer Discretionary Automobiles
Consumer Discretionary Distributors
Consumer Discretionary Diversified Consumer Services
Consumer Discretionary Hotels, Restaurants & Leisure
Consumer Discretionary Household Durables
Consumer Discretionary Internet & Catalogue Retail
Consumer Discretionary Leisure Products
Consumer Discretionary Media
Consumer Discretionary Multiline Retail
Consumer Discretionary Specialty Retail
Consumer Discretionary Textiles, Apparel & Luxury Goods
Consumer Staples Beverages
Consumer Staples Food & Staples Retailing
Consumer Staples Food Products
Consumer Staples Household Products
Consumer Staples Personal Products
Consumer Staples Tobacco
S&P 500 Stock Market Index
Sectors And Industries
Sector Industry
Energy Energy Equipment & Services
Energy Oil, Gas & Consumable Fuels
Financials Banks
Financials Capital Markets
Financials Consumer Finance
Financials Diversified Financial Services
Financials Insurance
Financials Mortgage REITs
Financials Thrifts & Mortgage Finance
Health Care Biotechnology
Health Care Health Care Equipment & Supplies
Health Care Health Care Providers & Services
Health Care Health Care Technology
Health Care Life Sciences Tools & Services
Health Care Pharmaceuticals
S&P 500 Stock Market Index
Sectors And Industries
Sector Industry
Industrials Aerospace & Defense
Industrials Air Freight & Logistics
Industrials Airlines
Industrials Building Products
Industrials Commercial Services & Supplies
Industrials Construction & Engineering
Industrials Electrical Equipment
Industrials Industrial Conglomerates
Industrials Machinery
Industrials Marine
Industrials Professional Services
Industrials Road & Rail
Industrials Trading Companies & Distributors
Industrials Transportation Infrastructure
S&P 500 Stock Market Index
Sectors And Industries
Sector Industry
Information Technology Communications Equipment
Information Technology Electronic Equipment, Instruments & Components
Information Technology Internet Software & Services
Information Technology IT Services
Information Technology Semiconductors & Semiconductor Equipment
Information Technology Software
Information Technology Technology Hardware, Storage & Peripherals
Materials Chemicals
Materials Construction Materials
Materials Containers & Packaging
Materials Metals & Mining
Materials Paper & Forest Products
Real Estate Equity Real Estate Investment Trusts
Real Estate Real Estate Management & Development
S&P 500 Stock Market Index
Sectors And Industries
Sector Industry
Telecommunication Services Diversified Telecommunication Services
Telecommunication Services Wireless Telecommunication Services
Utilities Electric Utilities
Utilities Gas Utilities
Utilities Independent Power & Renewable Electricity Producers
Utilities Multi-Utilities
Utilities Water Utilities
As you can see, the S&P 500 is an excellent representation of the overall domestic economy. All major sectors and industries are covered. This explains why most institutional investors prefer the S&P 500 over the Dow Jones Industrial Average.
In regard to ETFs, the SPDR family of exchange traded funds introduced the S&P 500 ETF on January 22, 1993. The ticker symbol is SPY. This ETF is historically significant because it was the very first exchange traded fund listed in the United States. SPY is easily the most heavily traded ETF, with daily volume usually exceeding 100 million shares.
SHORT-TERM VIEW – S&P 500 ETF SPY
Instead of examining the short-term view of SPY, let’s focus our attention on reviewing the individual sectors within SPY. Please review the following table.
SPDR S&P 500 ETF
SHORT-TERM VIEW
Sector Six-Month Rate of Return
Information Technology 14.11%
Consumer Discretionary 13.81%
Energy 9.98%
Materials 2.40%
Industrials 2.21%
Health Care 1.79%
Financials (1.02%)
Real Estate (3.58%)
Telecom Services (8.28%)
Consumer Staples (9.63%)
Utilities (11.16%)
By examining the results of the various sectors, we can conclude that the massive bull market (which officially began in March 2009) could be in the early stages of rolling over into a bear market. Why? Because interest rate sensitive stocks have historically performed poorly near the end of a bull market cycle. Conversely, high tech stocks and consumer discretionary stocks usually generate superior returns as the bull market reaches its zenith. This is known as “sector rotation,” as investors move funds from one sector to another in an attempt to outperform the stock market averages.
As you can see from the table, consumer staples and utilities have been in a mini bear market for the past six months. Both of these sectors are definitely interest rate sensitive. Therefore, this could be an early warning sign that the equity bull market could be drawing to a conclusion.
At the opposite end of the spectrum, high tech stocks and consumer discretionary stocks are outperforming the S&P average. Typically, these are the types of stocks that perform best near the end of a bull market cycle.
LONG-TERM VIEW – S&P 500 ETF SPY
Let’s take a long-term view of the individual sectors in order to determine if the data is providing a potential sell signal (similar to the short-term sell signal). Please examine the following table.
SPDR S&P 500 ETF
LONG-TERM VIEW
Sector Five-Year Rate of Return
Information Technology 157.75%
Consumer Discretionary 101.79%
Health Care 79.47%
Financials 79.23%
Industrials 74.58%
Materials 55.23%
Utilities 33.06%
Real Estate 32.39%
Consumer Staples 28.70%
Telecom Services (2.25%)
Energy (2.46%)
By examining the data from the table, we can easily observe that the 5-year results are quite similar to the 6-month results. For example, Information Technology and Consumer Discretionary are the top two leaders among all sectors in both time frames. At the bottom of the list, we find that Utilities are ranked 7th and Consume Staples are ranked 9th.
If we add all of this information together, a strong argument could be made that the stock market (as measured by the S&P 500) could be near the end of its massive 9-year bull market. Of course, the stock market “perma-bulls” will argue that sector rotation (by itself) is not enough to signal the end of a bull market. Most likely, the perma-bulls are correct. It will take more than sector rotation to convince investors that a new bear market is underway. However, sector rotation should not be ignored. This could be an early warning sign that the tide is turning in favor of the bearish camp.
SHORT-TERM CHART – S&P 500 ETF SPY
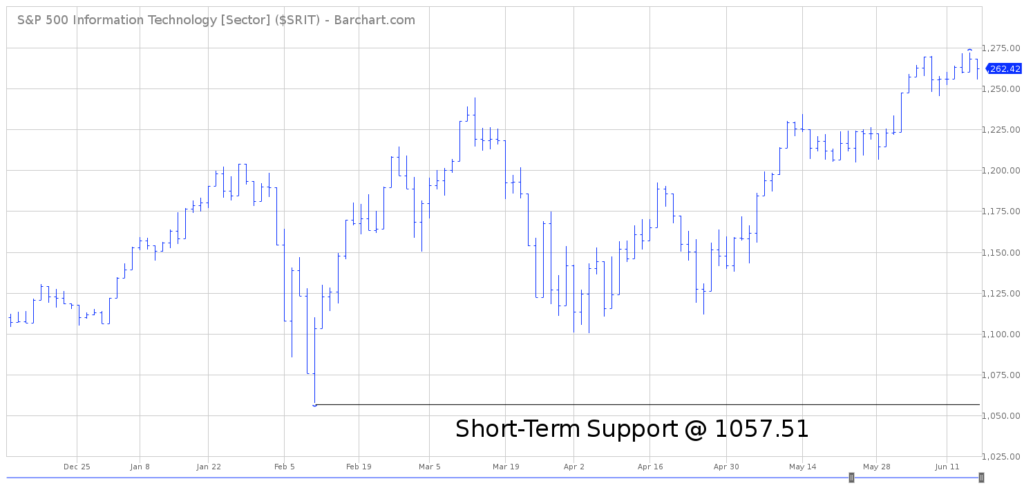
Instead of analyzing a short-term chart of SPY, let’s examine the chart pattern for the Information Technology sector ($SRIT). The 6-month chart looks incredibly bullish. Of course, markets always look most bullish near the top. The first sign of trouble would be a weekly close below 1057.51.
LONG-TERM CHART – S&P 500 ETF SPY
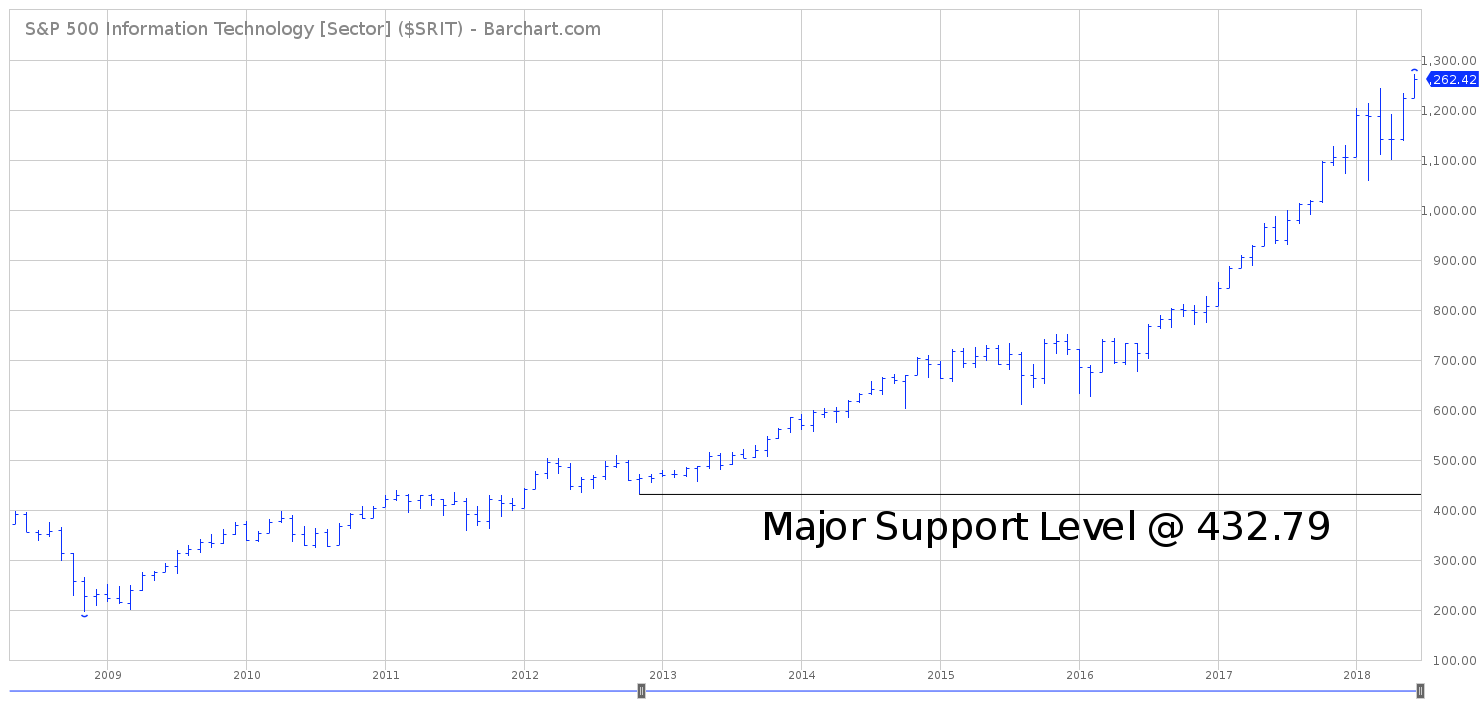
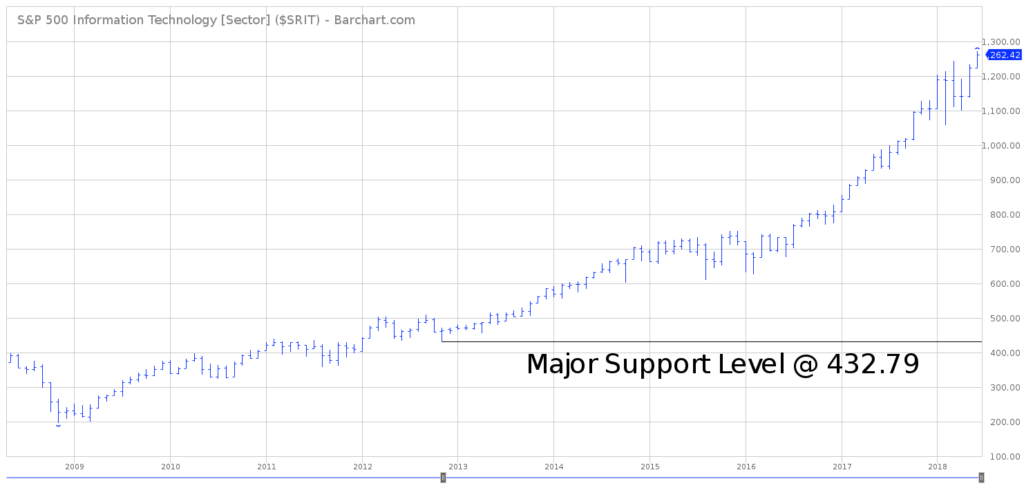
In terms of the long-term chart pattern, $SRIT is certainly in the bullish camp. Please examine the 10-year chart. It would take a weekly close below 432.79 to flip the chart from bullish to bearish.
Without question, investors are still pouring tons of money into the Information Technology sector of the S&P 500. However, when this sector begins to roll over, investors would be wise to pay attention. This could mark the “beginning of the end” of this historic bull market.


