AdvisorShares New Tech and Media ETF (FNG) Key Statistics
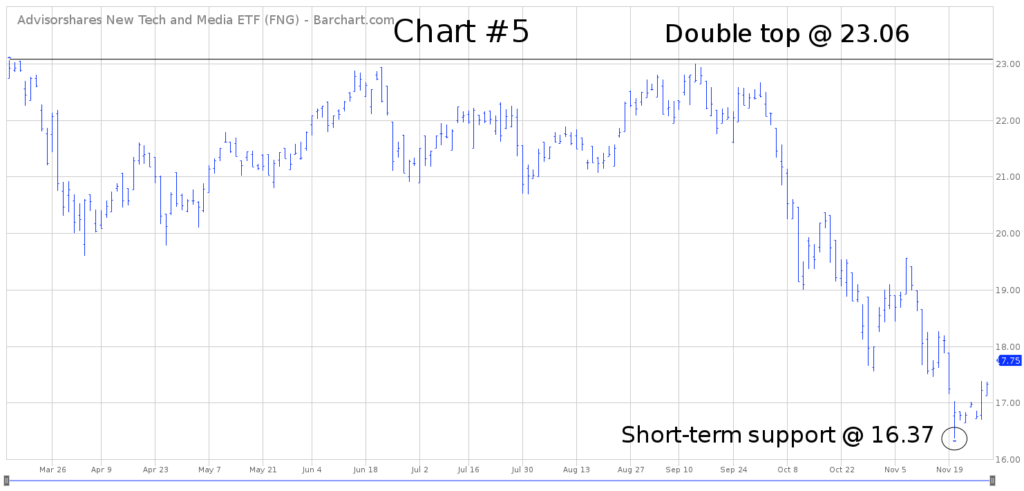
Minor Support Level 16.37 Minor Resistance Level 22.67
Major Support Level N/A Major Resistance Level N/A
Minor Buy Signal 23.00 Minor Sell Signal 14.56
Major Buy Signal N/A Major Sell Signal N/A
BRIEF OVERVIEW – FNG Exchange Traded Fund
The stock market (as measured by the S&P 500) has been in an uninterrupted bull market since March 2009. For 116 consecutive months, the S&P has not experienced a decline of greater than 20%. As long as the S&P index stays above 2352, the uninterrupted bull market will continue. However, for the first time in several months, it does appear that the stock market could be losing its momentum. Let’s review an important indicator which appears to be forecasting a new bear market in 2019.
All bull markets have one thing in common, a stock (or group of stocks) that leads the market higher. In other words, bull markets have a leader. The leader is usually a small group of stocks that does most of the “heavy lifting.” This small list of stocks will generate 40% to 60% of the entire bull market advance. Without these stocks, there would be no bull market. As these stocks slowly begin to rollover to the downside, this is a clear indication that the historic bull market is on the verge of ending. Let’s examine a few groups of leading stocks from previous bull markets in order to gain a better understanding on how these stocks influence the overall equity market.
Without question, the most popular group of stocks from the 1960s and 1970s was called the “Nifty Fifty.” This group of stocks was responsible for leading the overall stock market to much higher levels from the late-1960s through the mid-1970s. In fact, from 1967 to 1972, the Nifty Fifty helped the S&P 500 generate a 62.9% rate of return. In 1975 and 1976, the S&P enjoyed another healthy advance of 60.8% (thanks to the Nifty Fifty).
What was the Nifty Fifty? It was a list of blue-chip growth stocks that became very popular among investors. These 50 stocks were responsible for approximately 60% of the gains in the S&P 500 from 1967 through 1976. Eventually, the Nifty Fifty fell out of favor among Wall Street analysts, who slowly began to turn their attention to technology companies as the 1980s approached. The majority of the Nifty Fifty stocks were unable to successfully embrace the fact that the United States was slowly transitioning from industrial to technology. Consequently, many of these companies went out of business (usually in the form of an acquisition).
This explains why the stock market struggled from the late-1970s through the early-1980s. The stock market was searching for a new leader to push the market higher. Eventually, a group of new technology stocks filled the void left by the Nifty Fifty and the overall stock market enjoyed another bull run beginning in the mid-1980s.
Nifty Fifty
Company Name Company Name Company Name
American Home Products AMP Inc Anheuser-Busch
Avon Products Baxter International Black & Decker
Bristol-Myers Burroughs Corporation Chesebrough-Ponds
Coca-Cola Company Digital Equipment Dow Chemical
Eastman Kodak Eli Lilly and Company Emery Air Freight
First National City Bank General Electric Gillette
IBM Intl Flavors & Fragrances ITT
Johnson & Johnson Louisiana Land & Exploration Lubrizol
3M McDonald’s Merck & Co
MGIC Investment Corp PepsiCo Pfizer
Philip Morris Polaroid Procter & Gamble
Revlon Schering Plough Schlitz Brewing Co
Schlumberger Sears Roebuck & Co Simplicity Pattern
Squibb S.S. Kresge Texas Instruments
Upjohn The Walt Disney Company Wal-Mart
Xerox
Source Jeff Fesenmaier and Gary Smith
As you can see from the list, many of these companies have fallen out of favor during the past few decades. In fact, several of the stocks no longer exist. The Nifty Fifty carried the stock market for the better part of ten years. However, they eventually became overvalued and unable to meet earnings expectations.
During the great bull market of the “roaring 20s,” there was a small group of stocks similar to the Nifty Fifty which lead the stock market to sharply higher levels. These stocks mainly consisted of agriculture-based companies and a few industrial giants. These stocks suffered the same fate as the Nifty Fifty. They became ridiculously overvalued during the stock market bubble of the late 1920s.
Another example of stock market excess occurred during the late-1990s with the “high flying”
technology companies and internet stocks. Specifically, five stocks accounted for the majority of the stock market gains from 1994 through 1999. The list includes Microsoft, Intel, Cisco Systems, Oracle and Yahoo. Eventually, the bubble burst and these stocks became chronic underperformers throughout the first decade of the 2000s.
Fast forward to today’s raging bull market and we find another small group of stocks which have generated the lion’s share of the gains since 2009. These stocks even have their own acronym. They are known as the FANG stocks. The group includes Facebook, Amazon, Netflix and Google. Let’s examine the FANG stocks more closely in an effort to determine the current condition of the overall stock market. Are we on the verge of a nasty bear market or will the FANG stocks continue to lead the stock market to higher levels? Let’s examine the details.
In an effort to provide investors with exposure to the FANG stocks, AdvisorShares Investments, LLC introduced the New Tech and Media ETF on 11 July 2017. The ticker symbol is FNG. The ETF has 22 different holdings. The top five holdings include Amazon, Square Inc, Autodesk, Adobe Systems and Zendesk.
SHORT-TERM VIEW – FNG Exchange Traded Fund
Thanks to the recent decline in the overall stock market, FNG has lost its bullish momentum. The bears are in complete control of the ETF. The next level of support is 16.37. The bulls need a weekly close 22.67 in order to recapture the short-term momentum.
LONG-TERM VIEW – FNG Exchange Traded Fund
Historical results strongly support the theory that the majority of gains in a long-term bull market are captured by a small group of stocks. The most powerful bull markets in history are characterized by narrow participation in the broad stock market averages. Instead, only a tiny percentage of stocks actually reap the benefits of the bull market.
Unfortunately, the investment professionals and financial advisors who preach diversification, are probably providing the wrong guidance to their clients. On the contrary, the more profitable approach is to concentrate on the small universe of stocks that are actually pushing the stock market higher. In fact, let’s review the performance of the FANG stocks versus the S&P 500 since the bull market was launched in March 2009.
FANG Stocks Versus S&P 500
March 2009 – November 2018
FANG Stock Return Stock Index Return Difference
Facebook 224.3% (*) S&P 500 301.3% (77.0%)
Amazon 2,373.1% S&P 500 301.3% 2,071.8%
Netflix 5,066.6% S&P 500 301.3% 4,765.3%
Google 533.6% S&P 500 301.3% 232.3%
Source Barchart (*) IPO May 2012
With the exception of Facebook, the FANG stocks have dramatically outperformed the overall stock market. Investors who purchased the FANG stocks in March 2009, have crushed the broad market by 3,194.9%. Despite what the professional money managers have been preaching for the past several decades, diversification does not yield the best results.
Eventually, all bull markets come to an end. Based on the recent performance of the FANG stocks, a strong argument could be made that this historic bull market probably ended on 21 September, when the S&P 500 traded @ 2940.91. Let’s review the recent performance of the FANG stocks. Please review the following table.
FANG Stocks Recent Performance
09/01/2018 – 11/30/2018
FANG Stock Return Stock Index Return Difference
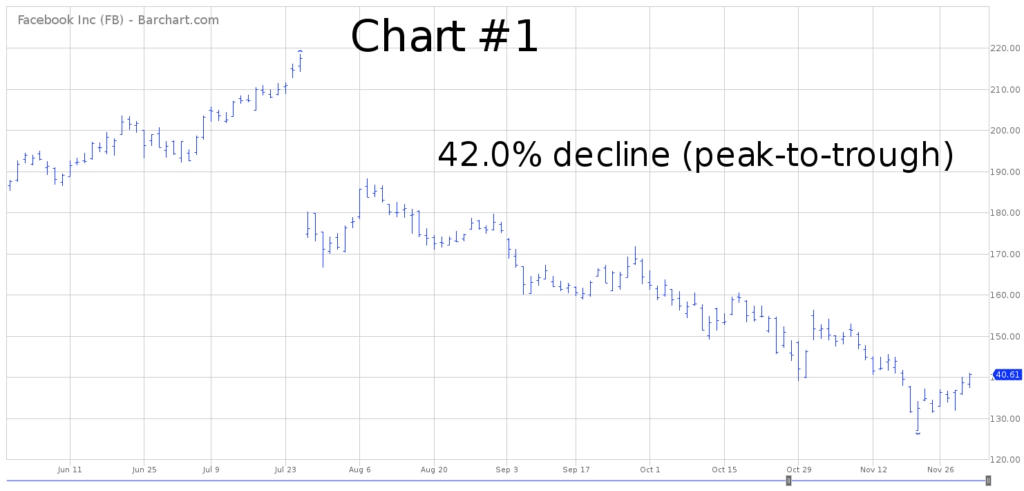
Facebook (19.98%) S&P 500 (4.87%) (15.11%)
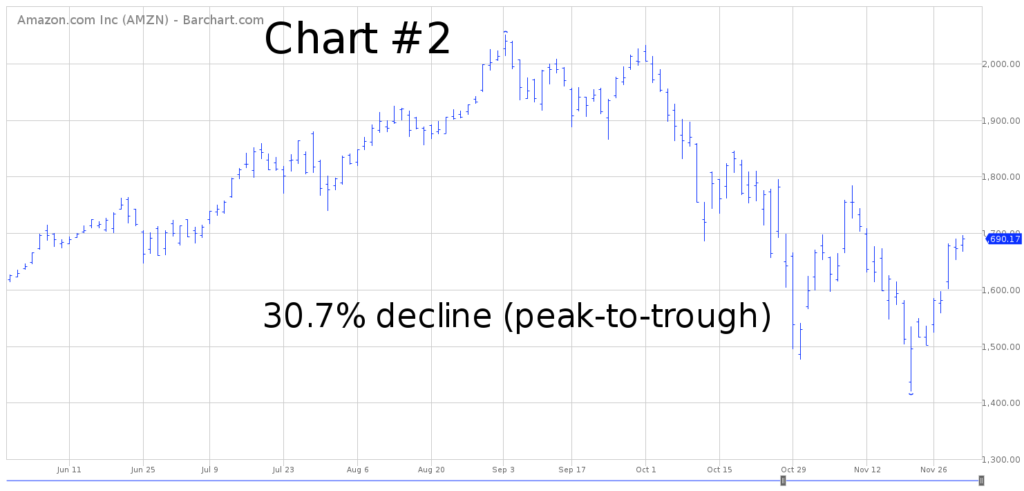
Amazon (16.02%) S&P 500 (4.87%) (11.15%)
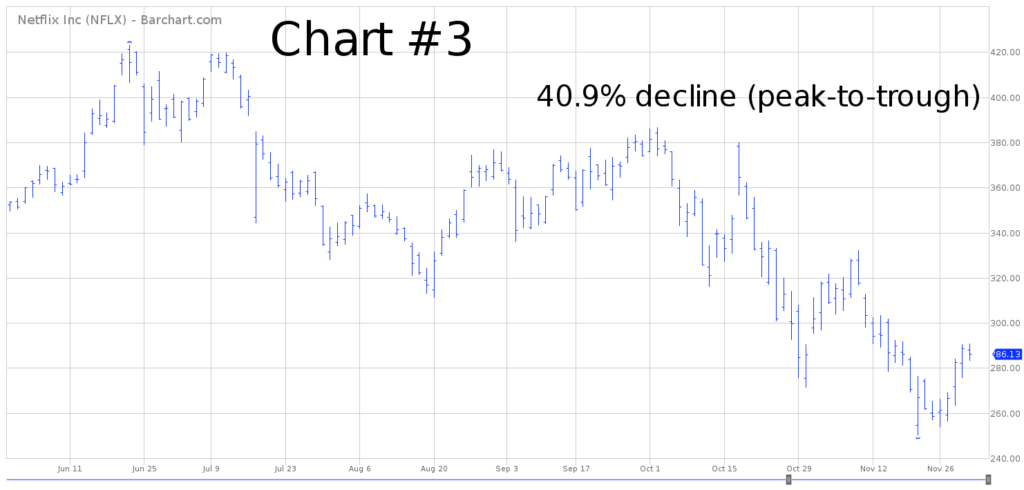
Netflix (22.18%) S&P 500 (4.87%) (17.31%)
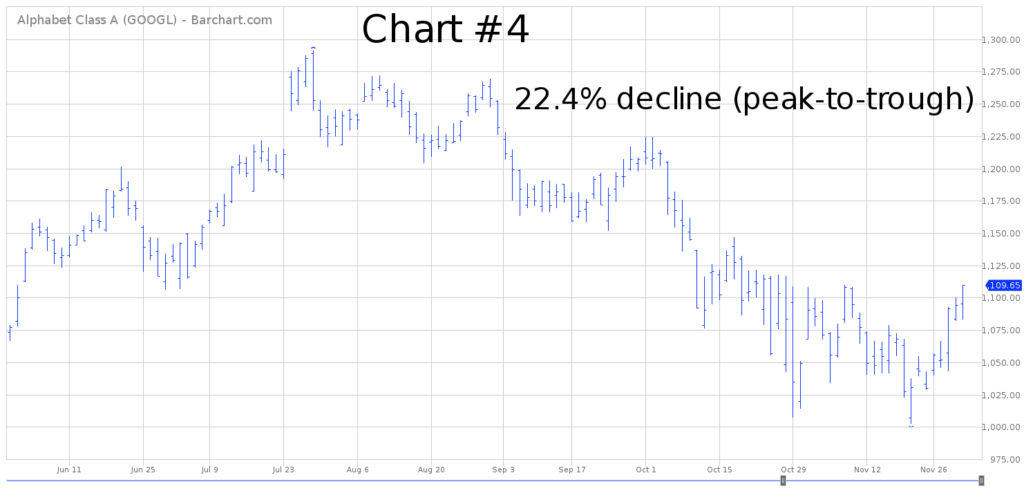
Google (9.92%) S&P 500 (4.87%) (5.05%)
Source Barchart
As you can see, the FANG stocks have collapsed during the past 90 days. This is an early warning sign that the overall stock market is on the verge of entering a bear market. It will be very difficult for the broad stock market to move higher without help from the FANG stocks. It is possible that the FANG stocks could “pass the baton” to another group of stocks in order to extend the bull market. However, this type of event rarely occurs. Instead, the most likely outcome is a continuation of lower prices across the board.
Very quickly, let’s examine the 6-month chart pattern of each FANG stock. All four stocks are definitely in bear market territory. More importantly, these charts are forecasting lower prices ahead. The charts include Facebook (Chart #1), Amazon (Chart #2), Netflix (Chart #3) and Google (Chart #4).
In terms of the long-term view of FNG, it’s impossible to make a long-term forecast because the EFT has been in existence for less than 18 months. Based on the data that does exist, the bears are in complete control of FNG.
SHORT-TERM CHART – FNG Exchange Traded Fund
Please review the 8-month chart of FNG (Chart #5). The ETF formed an important double top @ 23.06. This is definitely a bearish chart pattern. The next level of support is the recent low @ 16.37. The short-term chart pattern will turn bullish on a weekly close above 22.67.
LONG-TERM CHART – FNG Exchange Traded Fund
As we discussed previously, FNG only has 18 months of trading history. It’s difficult to determine the nature of the long-term chart. However, based on the recent performance of the FANG stocks, the long-term chart would probably be on the verge of rolling over into bearish territory.

