
iPath Bloomberg Sugar Subindex Total Return ETN (SGG)
Key Statistics
Thank you for reading this post, don't forget to subscribe!Daily Close 27.38 Long-Term Trend (100 SMA) Bearish
Minor Support Level 26.45 Minor Resistance Level 29.10
Major Support Level 23.79 Major Resistance Level 99.32
Minor Buy Signal 30.00 Minor Sell Signal 26.12
Major Buy Signal 107.06 Major Sell Signal 22.32
BRIEF OVERVIEW – SGG
Arguably, the global investment community is experiencing the greatest asset bull market of the past century. Almost all asset prices are rising simultaneously, which is an extremely rare occurrence. The list includes stocks, fine art, real estate, collectibles, classic cars, antiques, rare coins and digital currencies. These days, it’s virtually impossible to find an asset class that is not trading near the upper end of its historical price range. In fact, some financial historians claim that we are living in the “everything bubble,” in which the price of virtually all goods and services is rising in unison.
Despite the historical advance in asset prices, there is one asset class that has yet to participate in this global bull market. Commodities are the only major investment vehicle which still remains fairly valued. Admittedly, there are a few commodities which are trading near an
all-time high. For example, lumber and palladium recently scored a new all-time high. However, taken as a group, commodities are incredibly undervalued in relation to other asset classes. In fact, compared to the S&P 500, commodities are trading near their lowest level in recorded history.
Within the commodity universe, there is one sector which is trading near its lowest point in two decades. This sector is known as the “soft commodities.” The group includes coffee, cocoa, sugar, and orange juice. Measured against a basket of all commodities, the softs have been underperforming for the past decade. If we dig a little deeper, we will discover that sugar is the worst performer within the soft commodities group. During the past 20 years, the price of sugar has been flat. On a relative basis, it’s probably the most undervalued commodity in existence.
Sugar is heavily consumed on a global basis. In fact, sugar is often labeled a staple food, which means that it is a part of most people’s diet. It is part of our daily lives.
The iPath family of exchange traded notes (ETN) issued the Bloomberg Sugar Subindex Total Return ETN on June 24, 2008, using the ticker symbol SGG. Essentially, SGG is a pure play on the sugar market. It is designed for investors who want exposure to the sugar market without the speculative risk of investing in a sugar futures contract. SGG does not hold any equity positions. Instead, the ETN is invested in a sugar futures contract. SGG is underwritten by Barclays Bank PLC.
SHORT-TERM VIEW
SGG has been on a relentless decline for the past 12 months, as the price of sugar continues to drift lower. The bears are certainly in control of the short-term momentum. The next level of support is 26.45. A weekly close below 26.45 will usher in a new round of selling pressure, most likely resulting in a new all-time low below 26.12.
The bulls have made a few attempts to generate a rally during the past 12 months. However, each rally quickly fizzled out. In order to recapture the momentum, the bulls must produce a weekly close above 29.10.
LONG-TERM VIEW
From 2008 through 2012, the commodity markets enjoyed a tremendous rally. During this five year time period, almost every commodity recorded a new all-time high. The only market that was unable to generate a new high was sugar. In fact, the highest price for sugar dates all the way back to November 1974. Essentially, the market has been drifting sideways-to-lower for the past 44 years! There is no commodity that is cheaper today than it was 44 years ago, except sugar. Without question, sugar is the ultimate contrarian play!
The countries that produce the most sugar are Brazil, India, China, Thailand and Pakistan. Brazil is by far the largest single producing country. In fact, 25% of the world’s sugar supply is provided by Brazil.
Why has sugar become so inexpensive during the past few decades? The main reason is because the cost of production has fallen dramatically, as automation has replaced human labor. Additionally, sugar demand has fallen over the course of the past 20 years. High fructose corn syrup has slowly replaced cane sugar as the preferred method for adding the sweet taste to many of our favorite foods.
Although the demand for sugar as a food commodity has declined, there has been a dramatic increase in the demand for sugarcane ethanol. This product is being used as an alternative energy source. Brazil is the world leader in using sugarcane ethanol. In fact, in 2016, 44% of Brazil’s total sugar production was used for sugarcane ethanol. The country is quickly transitioning away from petroleum based energy to alternative energy. Sugarcane ethanol is leading the way in becoming Brazil’s main source for fuel.
Another reason for sugar’s declining price during the past several years can be attributed to extremely favorable growing conditions. Brazil and India (the two largest sugar producers) have enjoyed a string bumper crops for the past decade. As a result, world sugar production continues to increase. In fact, world sugar production for 2017/2018 is projected to reach a record high of 179.64 million metric tons. Please review the following table.
World Sugar Supply & Demand
Year World Production World Demand Ending Stocks
2006/2007 164,278 151,399 36,736
2007/2008 163,257 151,247 43,080
2008/2009 143,833 154,448 29,836
2009/2010 153,184 154,926 28,028
2010/2011 162,221 155,938 29,491
2011/2012 172,349 160,217 35,190
2012/2013 177,843 166,445 42,290
2013/2014 175,886 166,972 44,850
2014/2015 177,419 168,740 48,811
2015/2016 164,737 170,195 43,871
2016/2017 170,814 172,641 38,844
2017/2018 179,636 172,333 38,245
Note million metric tons
As you can see, world sugar production continues to increase on an annual basis. However, please notice how world demand is also increasing. For 2017/2018, the world ending supply of sugar will be at its lowest level in six years. Although sugar production is increasing, so is the demand. The majority of this demand is the result of Brazil’s aggressive energy policy of increasing its usage of sugarcane ethanol. Although sugar demand is decreasing in terms of food usage, overall global demand is on the rise.
As we discussed briefly, Brazil and India have experienced several consecutive years of perfect growing seasons. However, this trend won’t last forever. Weather patterns are extremely cyclical in nature. Consequently, the major sugar producing countries of the world could easily endure several years of poor growing conditions.
Another potentially bullish factor for sugar is the steady increase in the global population, particularly among the developing countries like Argentina, China, Mexico, Nigeria and Russia. As these countries become more economically developed, their per capita income will begin to rise. As a result, consumer demand for staple foods like sugar will increase.
Sugar could easily be on the verge of a “perfect storm scenario” of much higher prices within the next 12 to 24 months. Several fundamental factors are lining up in favor of much higher prices.
The long-term view of SGG is decidedly bearish. The ETN has been drifting lower for the past 6 ½ years (with the exception of a small rally in the first half of 2016). The long-term momentum is heavily in favor of the bears. In fact, SGG could easily post a new all-time low in 2018. The bulls need a weekly close above 99.32 to reclaim the momentum (which is highly unlikely any time during the next several months).
SHORT-TERM CHART – SGG
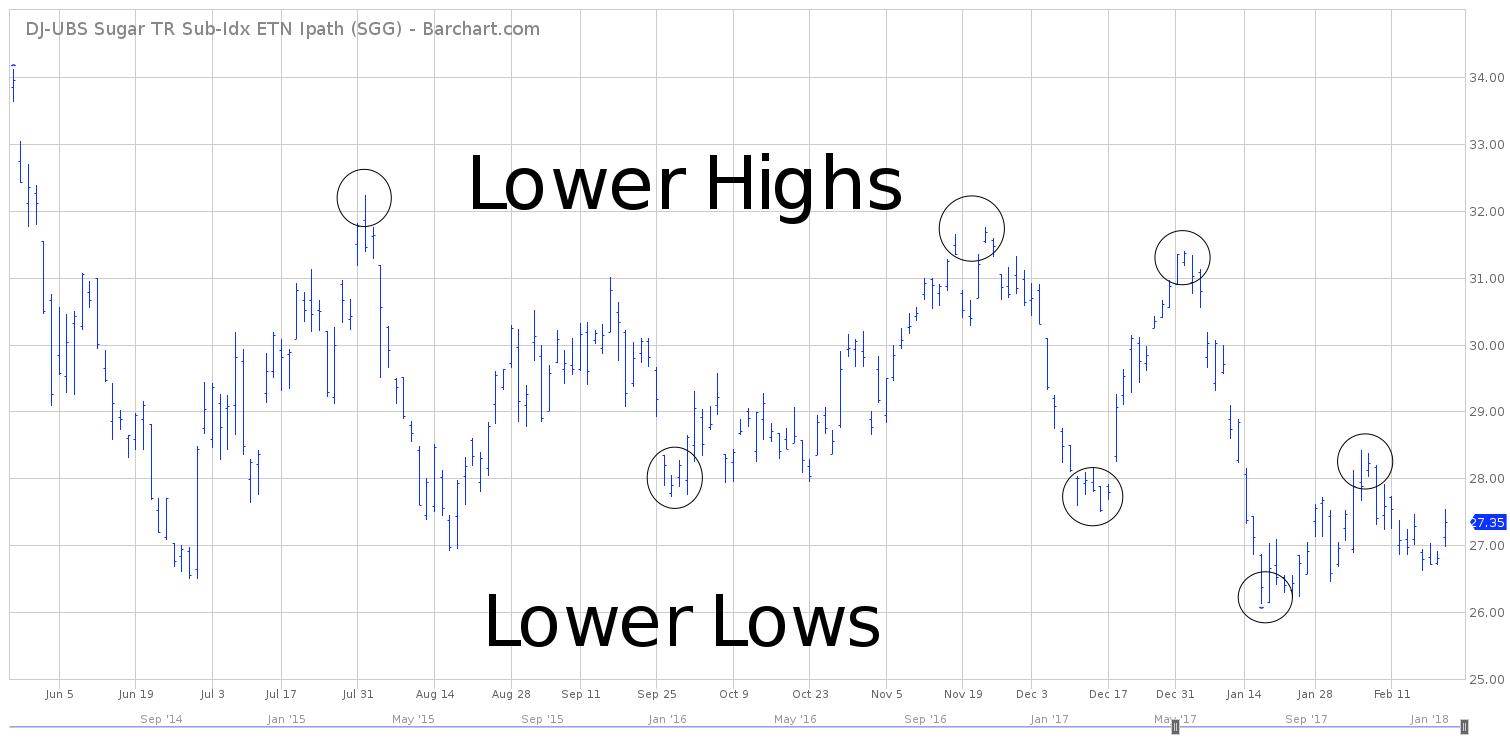
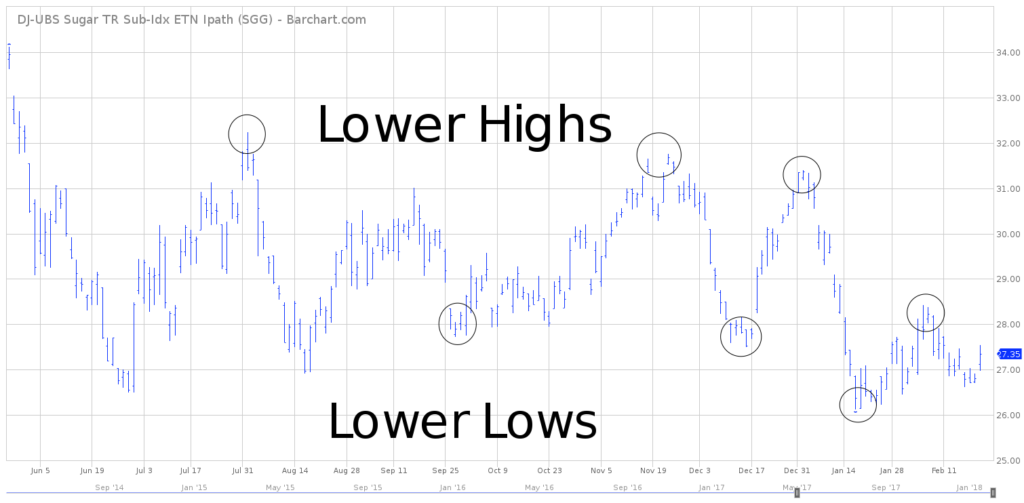
Please review the 9-month chart of SGG. Without question, the bears are in control. As you can see, SGG has made a series of lower highs and lower lows. This is a classic definition of a bearish chart pattern.
The most likely scenario is a retest of the January 18th low @ 26.12. The chart pattern will turn bullish on a weekly close above 29.10.
LONG-TERM CHART – SGG
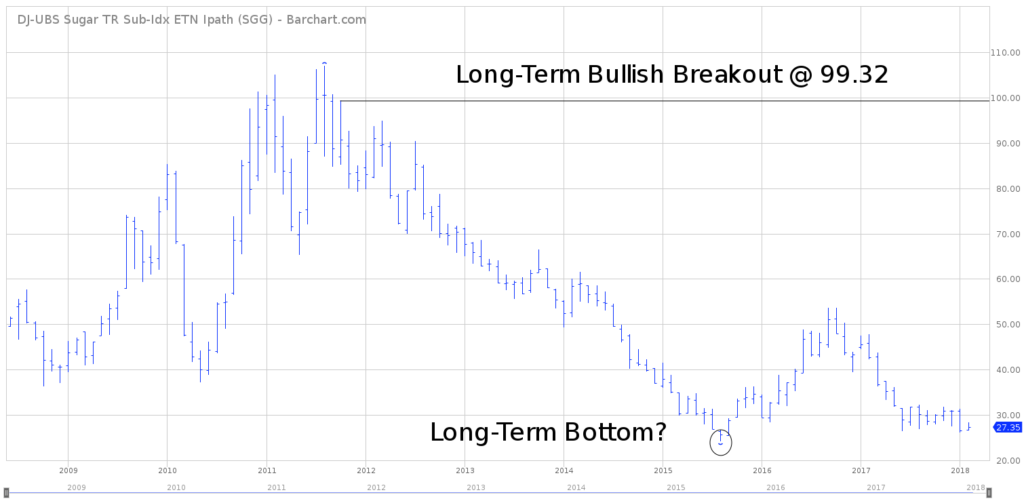
Please review the 10-year chart of SGG. This chart captures the entire trading history of the ETN. Based on the fact that sugar has been drifting sideways-to-lower for the past decade, we should not be surprised that SGG has a long-term bearish chart pattern. The next major support level is 23.79. A weekly close above 99.32 will turn the chart pattern in favor of the bulls.
Did SGG form a long-term bottom in August 2015 @ 24.16? Of course, it’s impossible to accurately answer this question. However, at these price levels, SGG is a very low risk investment opportunity. This could be the contrarian play of the decade!


