
iShares MSCI China ETF (MCHI)
Key Statistics
Minor Support Level 52.37 Minor Resistance Level 72.16
Major Support Level 39.02 Major Resistance Level 76.72
Minor Buy Signal 73.42 Minor Sell Signal 51.39
Major Buy Signal 95.48 Major Sell Signal 33.44
BRIEF OVERVIEW – MCHI
Over the course of the past 30 years, the Chinese economy has literally exploded. In 1987, China was a $327 billion economy. Three decades later, in 2017, the total value of all goods and services produced was $12.25 trillion. This represents a dramatic increase of 3,646%. Economic growth of this magnitude is truly unprecedented. For the sake of comparison, the United States economy grew 296% during the same time period (1987 – 2017). In dollar terms, the US is a $19.4 trillion economy. Please review the following table.
Economic Output
Year Ending 2017
Rank Country/Region Economic Output
01 United States $19.4
02 China $12.2
03 Japan $4.9
04 Germany $3.7
05 United Kingdom $2.6
06 India $2.6
07 France $2.5
08 Brazil $2.0
09 Italy $1.9
10 Canada $1.6
Source World Bank
Note Trillion US Dollars
As you can see from the table, the United States and China are clearly “head and shoulders above” the rest of the top GDP countries. China has been slowly gaining on the United States for the past two decades. However, many analysts and Wall Street economists claim China’s growth rate is simply unsustainable. Additionally, these same analysts are forecasting a crippling recession sometime during the next 3 to 5 years. Will this bearish forecast turn into a reality? During the past decade, many pundits in the financial community have predicted the demise of the Chinese economy. So far, they have all proven to be completely wrong. Maybe this time is different. Could the world’s second largest economy finally roll over? Let’s review the details.
In an effort to provide investors with exposure to the Chinese economy, the iShares family of exchange traded funds launched the MSCI China ETF on 29 March 2011. The ticker symbol is MCHI. The ETF provides investors with exposure to the largest publicly traded companies in China. MCHI has a total of 293 different holdings. The top five companies include Tencent Holdings Ltd, Alibaba Group Holdings ADR, China Construction Bank Corp, China Mobile Ltd and Baidu ADR.
SHORT-TERM VIEW – MCHI
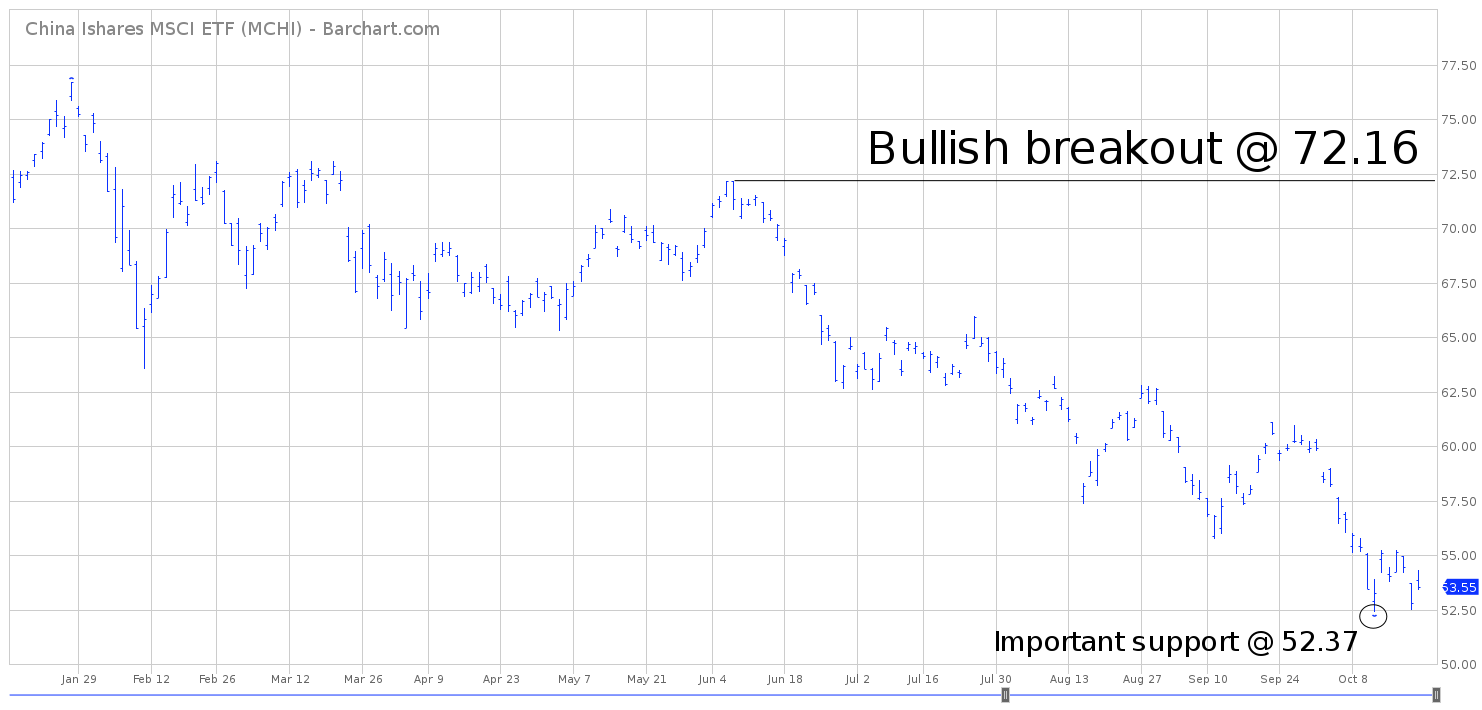
The bears are definitely in control of the short-term view. MCHI has been drifting continuously lower since January. The next level of support is 52.37. In order to recapture the momentum, the bulls need a weekly close above 72.16. Given the recent decline in the overall equity market, the most likely scenario is a continuation of the bearish momentum. However, at least for now, it appears rather unlikely that MCHI is in the early stages of a long-term sustainable decline.
LONG-TERM VIEW – MCHI
From a long-term investment perspective, China is a country analysts love to hate. Wall Street economists and investment professionals have been predicting the demise of China for the past two decades. However, the country continues to generate robust economic growth on an annual basis. Please review the following tables.
China Annual GDP
1987 – 2017
Year %GDP Year %GDP Year %GDP
1987 11.7% 1988 11.2% 1989 4.2%
1990 3.9% 1991 9.3% 1992 14.2%
1993 13.9% 1994 13.0% 1995 11.0%
1996 9.2% 1997 9.2% 1998 7.8%
1999 7.7% 2000 8.5% 2001 8.3%
2002 9.1% 2003 10.0% 2004 10.1%
2005 11.4% 2006 12.7% 2007 14.2%
2008 9.7% 2009 9.4% 2010 10.6%
2011 9.5% 2012 7.9% 2013 7.8%
2014 7.3% 2015 6.9% 2016 6.7%
2017 6.9%
Source World Bank
United States Annual GDP
1987 – 2017
Year %GDP Year %GDP Year %GDP
1987 3.5% 1988 4.2% 1989 3.7%
1990 1.9% 1991 0.1% (-) 1992 3.6%
1993 2.7% 1994 4.0% 1995 2.7%
1996 3.8% 1997 4.5% 1998 4.4%
1999 4.7% 2000 4.1% 2001 1.0%
2002 1.8% 2003 2.8% 2004 3.8%
2005 3.3% 2006 2.7% 2007 1.8%
2008 0.3% (-) 2009 2.8% (-) 2010 2.5%
2011 1.6% 2012 2.2% 2013 1.7%
2014 2.6% 2015 2.9% 2016 1.5%
2017 2.3%
Source World Bank
As you can see from the tables, China has produced incredibly consistent economic growth over the course of the past 20 years, easily outpacing the United States. The “doom and gloom” crowd has been completely wrong concerning the Chinese economy. Where do we go from here? Can China continue to maintain its torrid pace of economic growth? At least for now, the answer is “Yes.” There’s nothing on the horizon that would suggest a severe economic downturn in the country of China.
The economic leaders in China have developed a long-term plan to slowly transition from a command (government controlled) economy to a traditional (market based) economy. In fact, this plan was originally initiated 30 years ago. Chinese leaders realized the benefits of a traditional economy, similar to the United States. As a result, economic leaders in China continue to move in the direction of a market based system.
Today, the Chinese economy is labeled as a mixed economy, incorporating a command economy with a traditional economy. This explains why many professional economists have been wrong concerning their bearish outlook on China. They completely underestimated China’s ability to transition from a government controlled economic system to a market based economy.
There are 1.4 billion people living in China. Economic leaders in China are fully aware of the incredible amount of spending power that can be unleashed throughout the country if all citizens have the ability to earn higher wages in a traditional economy. During the past three years, China’s GDP growth rate has declined slightly. However, this has been a planned contraction by the economic leaders in China as they slowly reduce their dependence on government spending. Chines authorities have a very precise plan of action in place to pass the baton from government spending to a market based economy. This plan will unfold over the course of the next decade.
Of course, the Chinese skeptics are claiming that the government will fail in their attempt to transition to a consumer lead economy. Their argument is based on the fact that China’s debt level is unsustainable. They believe the country’s current debt-to-GDP ratio is out of control, which will lead to a currency collapse and sharply higher interest rates. There is no denying the fact that the country has an unhealthy debt-to-GDP ratio at 257%. For the sake of comparison, the US debt-to-GDP ratio is 152%.
Although China’s debt burden is much higher than all other G20 countries (with the exception of Japan), the country has an extremely high domestic savings rate. In 2017, Chinese citizens saved 47.0% as a percentage of GDP. It should come as no great surprise that the United States savings rate is well below the Chinese. The US has a meager savings rate of 18.1% of GDP. Admittedly, China does carry an extremely high level of debt. However, the debt is easily managed due to its high savings rate. Therefore, an imminent collapse of the Chinese economy is highly unlikely.
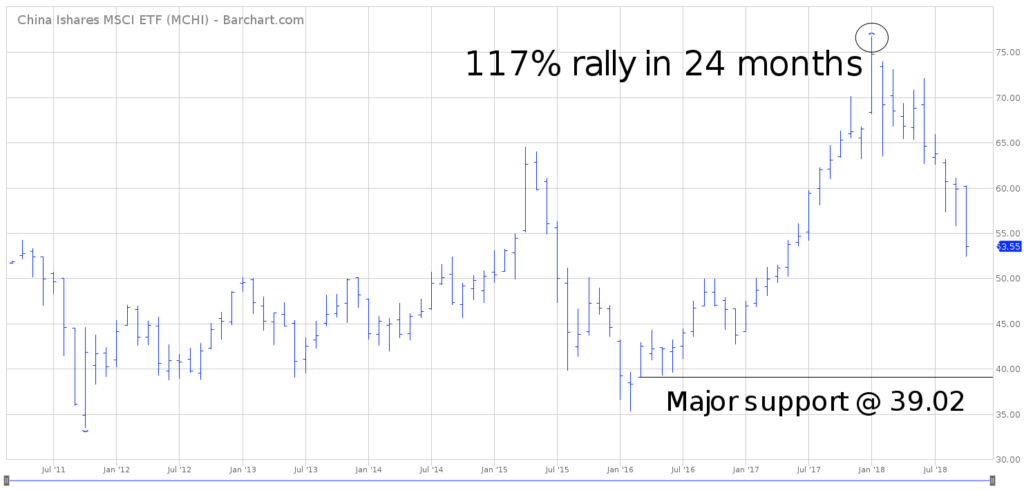
In regard to MCHI, the long-term view is bullish. The next level of resistance is the all-time high @ 76.72. In order to reverse the long-term momentum, the bears need a weekly close below 39.02. The most likely scenario is a continuation of the bullish momentum.
SHORT-TERM CHART – MCHI
Please review the attached 9-month chart of MCHI. Clearly, the bears are in control of the short-term chart pattern. The ETF has been in a downtrend since January. The next level of support is 52.37,
followed by 51.39. The chart pattern will turn bullish on a weekly close above 72.16. Based on the current chart pattern, the correction in 2018 is nothing more than an intermediate-term correction.
LONG-TERM CHART – MCHI
Please review the attached 7-year chart of MCHI. This chart covers the entire trading history of the ETF. Despite the decline throughout 2018, the bulls are in control of the long-term chart pattern. MCHI increased 117% from January 2016 through January 2018. Therefore, it’s not uncommon for the ETF to generate a sizeable correction. As long as MCHI stays above 39.02 on a weekly closing basis, the bulls are in control of the long-term chart pattern.


