
iShares 20-Year Treasury Bond ETF (TLT)
Key Statistics
Minor Support Level 117.26 Minor Resistance Level 125.64
Major Support Level 101.69 Major Resistance Level 138.50
Minor Buy Signal 126.51 Minor Sell Signal 116.51
Major Buy Signal 143.62 Major Sell Signal 97.35
BRIEF OVERVIEW – Bond ETF TLT
On April 13th, the interest rate on a 30-year conventional mortgage reached its highest level in
over four years @ 4.62%. This marks the first time since January 2014 that mortgage rates have been above 4.5%. Are interest rates on the verge of moving dramatically higher or can we expect rates to remain near historically low levels? Let’s examine the details.
The vast majority of the investment community is under the impression that the Federal Reserve determines the level of long-term interest rates. This is simply not true. In fact, the Fed has absolutely no direct control of long-term rates. Instead, the Fed is responsible for adjusting the level of the federal funds rate. What is the federal funds rate? It is the rate that member banks charge each other for overnight loans. Therefore, the Federal Reserve controls short-term rates, not long-term rates.
If the Fed doesn’t adjust long-term interest rates, who is responsible for determining the level of these rates? The “market” is the decision maker of long-term rates. Each day, investors all around the globe are constantly buying and selling interest rate products (i.e. government bonds, corporate bonds and tax-free bonds). As new information enters the market, traders and investors adjust their portfolios in response to the latest news report or economic data. It’s an ongoing process that never stops. This is how the level of long-term rates are derived on a daily basis.
The iShares family of exchange traded funds introduced the 20-Year Treasury Bond ETF, with the objective of allowing investors the opportunity to participate in the future direction of long-term interest rates. The ETF was launched on July 22, 2002, using the ticker symbol TLT. The ETF consists entirely of United States Treasury Bonds with a maturity of greater than 20 years. Therefore, TLT is a “pure play” on long-term interest rates. In fact, TLT is the most popular interest rate ETF in terms of daily volume.
SHORT-TERM VIEW Bond ETF TLT
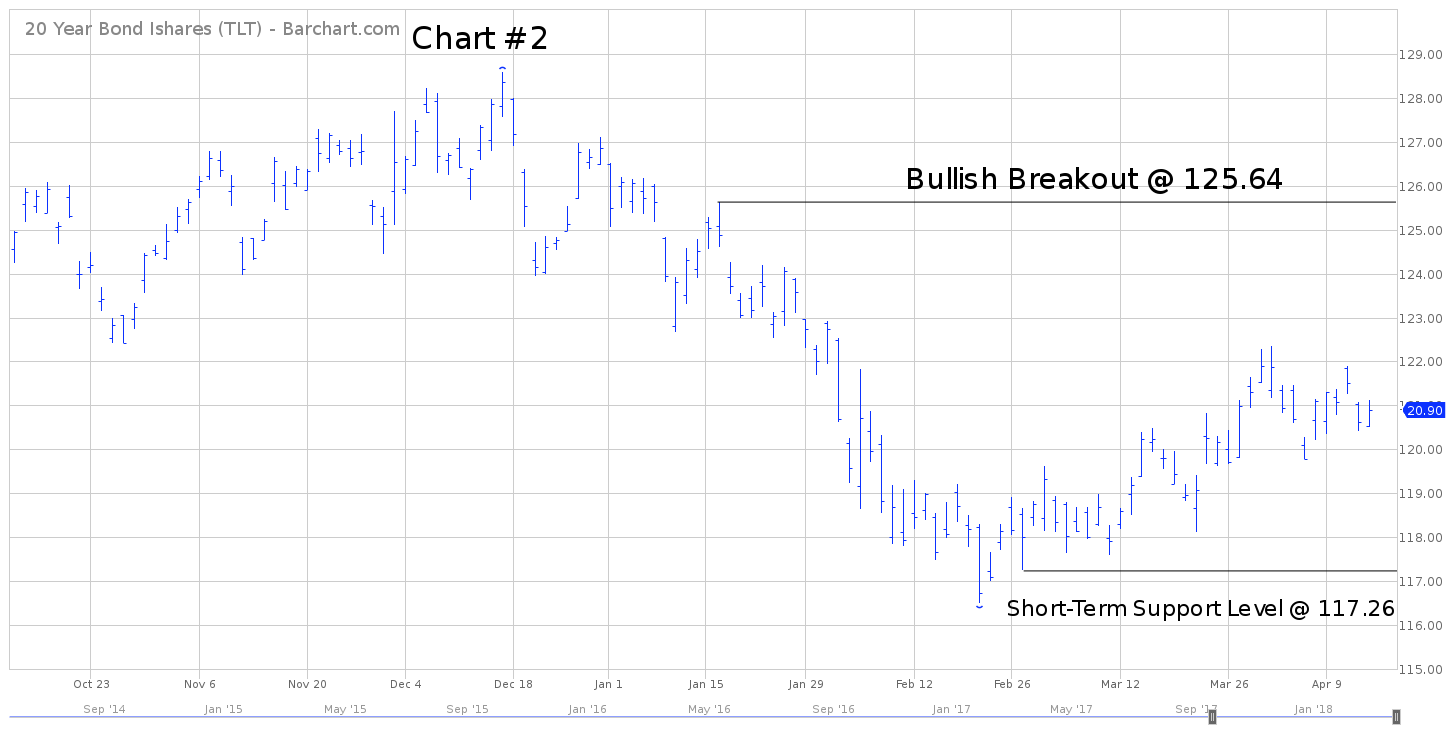
Despite a recent advance over the course of the past four weeks, the short-term momentum is in favor of the bears. Essentially, prices have been drifting lower since September 2017. Interest rates move in the opposite direction of the price. Therefore, rates have been rising as the price of TLT has been declining.
The next level of support is 117.26. The bulls need a weekly close above 125.64 in order to recapture the momentum.
LONG-TERM VIEW – Bond ETF TLT
Long-term bonds (i.e. maturity greater than 20 years) have been in a continuous secular bull market since September 1981. Of course, this means that interest rates have been declining during the same time period. The secular bull market in bonds has existed for so long that most of the investment professionals on Wall Street have never witnessed a bond bear market. Their entire trading career has been one giant bull market.
Of course, all good things must end. Eventually, the multi-year bond bull market will roll over to the downside. In fact, a strong argument could be made that the massive bull market reached its climax in July 2016. Long-term interest rates have been pushing their way higher for the past 20 months. For example, the interest rate on a 30-year mortgage was 3.36% in July 2016. Today, the rate is 4.62%. Therefore, bond prices have been declining as rates are rising.
All financial markets are cyclical in nature, including interest rates. However, interest rate cycles are historically much longer than other markets. For example, it’s not uncommon for long-term rates to move in the same direction for 40 years or longer. Therefore, if an investor can capture the beginning of a new interest rate cycle, the profit potential can be enormous.
Did long-term bonds form a major top in July 2016? Are interest rates headed higher for the next few decades? Obviously, it’s impossible to answer this question with 100% accuracy. However, we can form an educated guess by examining a multi-year chart of Treasury Bond prices.
In August 1977, the Chicago Board of Trade (CBOT) introduced the US Treasury Bond futures contract. This investment product tracks the daily price fluctuations of long-term government bonds. It is an excellent vehicle for studying the performance of the bond market.
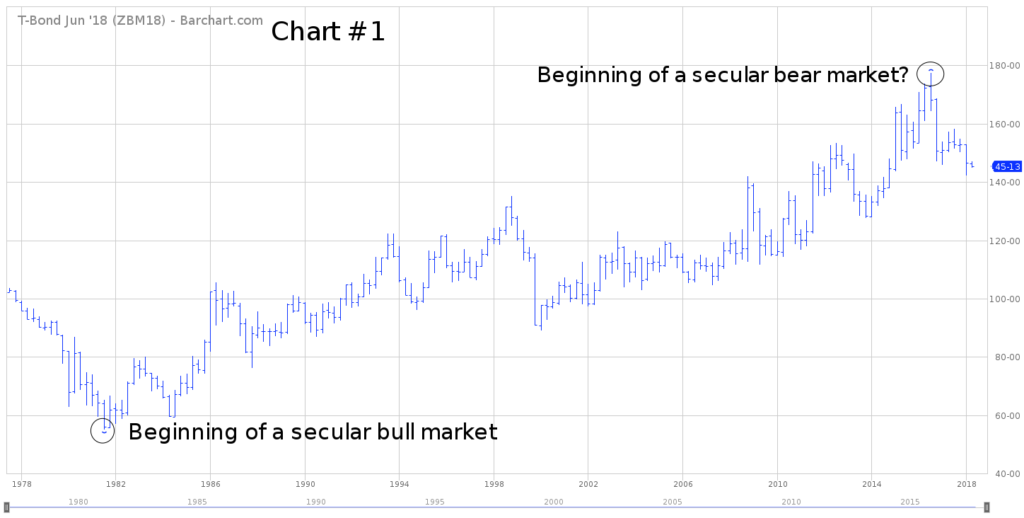
The attached chart displays the entire 41-year trading history of the CBOT Treasury Bond contract (Chart #1). As you can see from the chart, bond prices formed an important bottom in September 1981. This marked a multi-year low in bond prices and a corresponding top inlong-term interest rates. This was the beginning of a secular bull market in bond prices.
As you can see from the chart, bond prices steadily moved higher for the next 3 ½ decades. At least for now, it does appear that a significant top was formed in July 2016. If this analysis is correct, we are in the very early stages of a secular bear market for bonds. Of course, this means interest rates will move steadily higher for the next 30 to 40 years.
In order to confirm the secular top in bond prices, the CBOT bond futures contract must penetrate 127-27 on a monthly closing basis. Until this price level is violated, there is still a decent chance that the secular bull market for bonds is still intact.
The most likely scenario is that bond prices will drop below 127-27 within the next 18 to 24 months, and a new secular bear market will be underway. If we are indeed witnessing a new interest rate trend, mortgage rates could be materially higher a few years from now. For example, during the previous secular bear market in bond prices, interest rates on a 30-year mortgage approached 17%. Therefore, mortgage interest rates could easily hit double digits in 3 to 5 years.
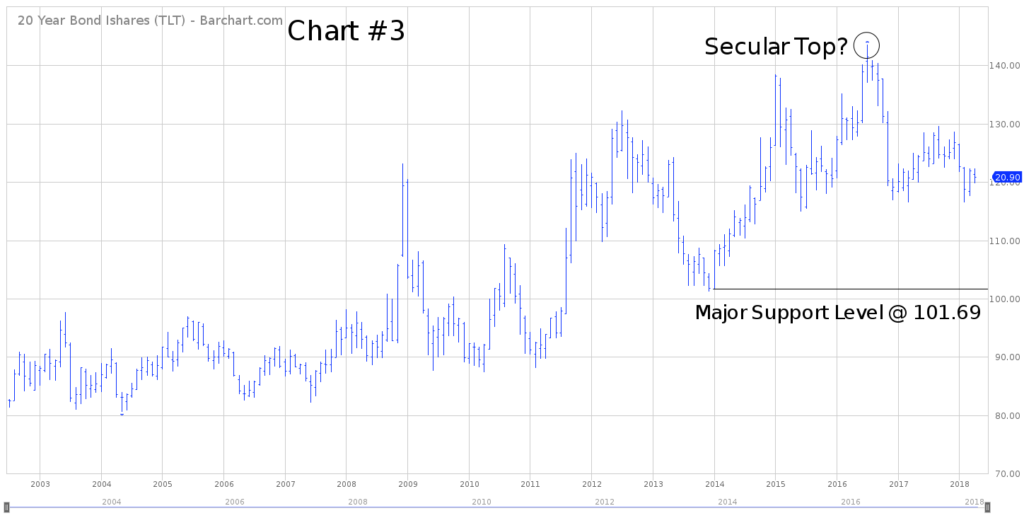
The long-term momentum of TLT is still in favor of the bulls, despite steadily declining prices since July 2016. On the surface, it certainly appears as though the bears will capture the downside momentum in the near future. However, we must respect the fact that the bulls have been in control of TLT for a very long time. A weekly close below 101.69 will turn the long-term momentum in favor of the bears.
SHORT-TERM CHART – Bond ETF TLT
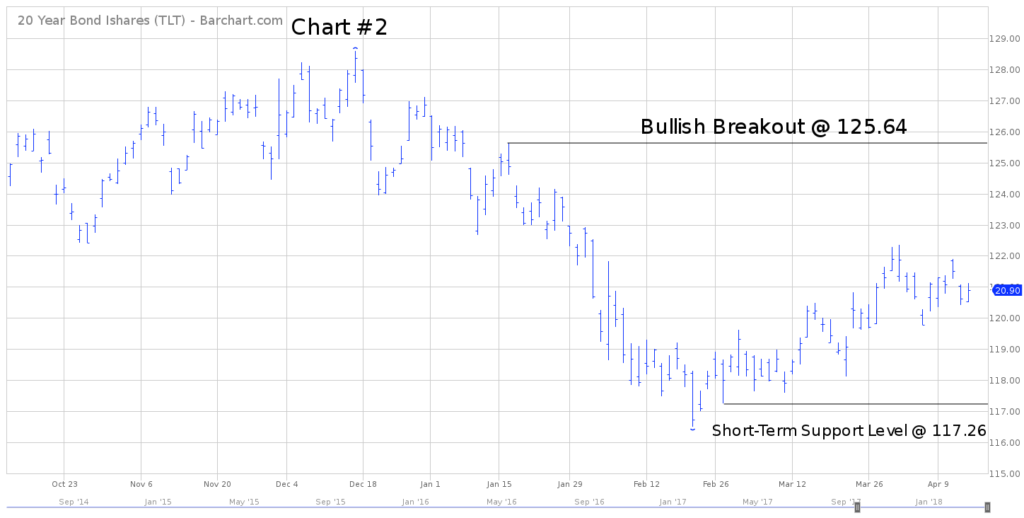
Please review the 6-month chart of TLT (Chart #2). Despite the recent advance, the short-term chart pattern is bearish. The next level of support is 117.26. The bulls need a weekly close above 125.64 in order to turn the chart pattern in their favor. Based on the current chart formation, the most likely scenario is a rollover to the downside.
LONG-TERM CHART – Bond ETF TLT
Please review the 16-year chart of TLT (Chart #3). This chart includes the entire trading history of TLT. Most likely, a secular top was formed in July 2016 @ 143.62. However, TLT must produce a weekly close below 101.69 in order to confirm the secular top.
Please note that 101.69 corresponds with 127-27 on the T-Bond futures chart. If these two support levels are penetrated on a weekly closing basis, we should expect rising interest rates for the next 20 to 30 years.


