
Invesco CurrencyShares Euro Trust (FXE)
Key Statistics
Minor Support Level 108.32 Minor Resistance Level 115.21
Major Support Level 100.46 Major Resistance Level 151.27
Minor Buy Signal 116.30 Minor Sell Signal 107.26
Major Buy Signal 156.39 Major Sell Signal 92.67
BRIEF OVERVIEW – Euro CurrencyShares FXE
The Euro is the official currency of the European Union, which is a political and economic union comprised of 28 member states. The currency was officially introduced to the world financial markets on 1 January 1999. The main purpose of the Euro was to bring several countries together using a common currency in order to increase trade with other global economies. Essentially, the Euro was designed to become a legitimate alternative to the US Dollar. Ultimately, the European Union wanted to become the “United States of Europe.” This would not be possible without a common currency.
The Euro (along with the European Union) has been in existence for 19 years. The currency will celebrate its 20th anniversary on 1 January 2019. How well has the Euro performed during the past 20 years? Has the Euro lived up to its expectations as a legitimate alternative to the US Dollar? Let’s take a step back and examine the performance of the Euro over the past two decades.
The Invesco family of exchange traded funds created the CurrencyShares Euro Trust in an effort to provide investors with exposure to the Euro. The launch date was 9 December 2005, using the ticker symbol FXE. As the name implies, FXE is not an exchange traded fund as defined by the Investment Company Act of 1940. Instead, it was established as a grantor trust, with the Bank of New York Mellon acting as the trustee of the trust. Although FXE is not legally registered as an exchange traded fund, it trades in exactly the same manner as an ETF. As far as investors are concerned, there is no difference between a grantor trust and an ETF.
SHORT-TERM VIEW – Euro CurrencyShares FXE
FXE has been drifting lower throughout most of 2018. The short-term momentum is definitely in favor of the bears. The next level of support is the 15 August low @ 108.32. Most likely, 108.32 marked an important short-term bottom. The bulls need a weekly close above 115.21 in order to recapture the momentum.
Based on the Aroon Oscillator, FXE has a moderately oversold reading of -32. The Aroon Oscillator is programmed differently than most stochastic indicators. The oscillator fluctuates between -100 and +100. A reading of 0 would indicate a neutral position. Therefore, a reading of -32 with FXE is considered moderately oversold. Most likely, the market is fairly close to a short-term bottom.
LONG-TERM VIEW – Euro CurrencyShares FXE
In comparison to other national currencies, the Euro has very little to offer from a historical perspective. The currency has only been in existence for 19 years. However, despite its relatively young age, the Euro ranks #2 in terms of global trading volume. Only the US Dollar attracts more daily volume on the foreign exchange markets.
As we discussed earlier, the Euro is the common currency for the European Union (EU). The EU consists of 28 member states, 19 of which use the Euro as their country’s currency. Please review the following table.
European Union
Member States
Country Currency Country Currency
Austria Euro Belgium Euro
Bulgaria Lev Croatia Kuna
Cyprus Euro Czech Republic Czech Koruna
Denmark Krone Estonia Euro
Finland Euro France Euro
Germany Euro Greece Euro
Hungary Forint Ireland Euro
Italy Euro Latvia Euro
Lithuania Euro Luxembourg Euro
Malta Euro Netherlands Euro
Poland Zloty Portugal Euro
Romania Leu Slovakia Euro
Slovenia Euro Spain Euro
Sweden Krona UK Sterling
Source Statista
As you can see, the vast majority of the countries use the Euro as their national currency. Many economists and Wall Street investment professional have been predicting the demise of the Euro for the past several years. Despite all of the “doom and gloom,” the Euro continues to serve its role as a store of value and medium of exchange for the EU members.
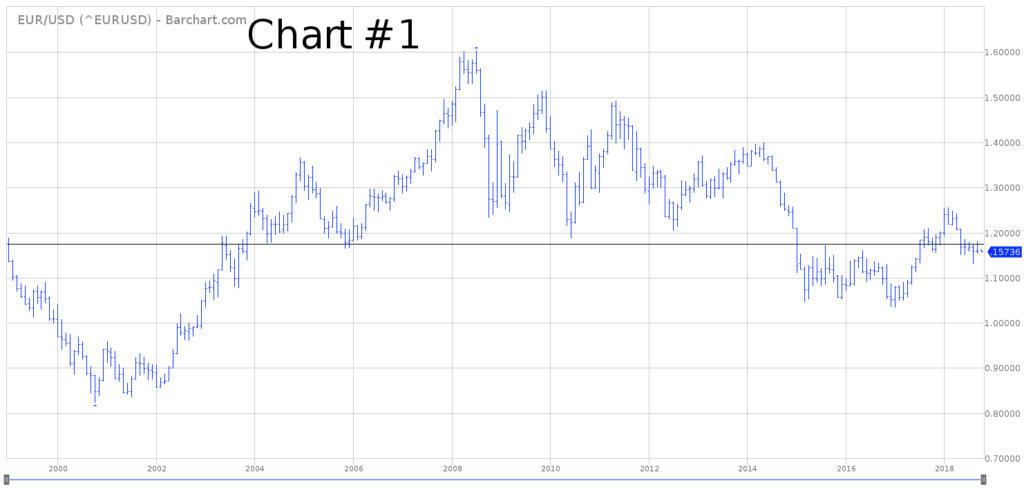
Let’s review a long-term chart of the Euro (Chart #1). This chart covers the entire trading history of the Euro, beginning on 1 January 1999. Please review the horizontal line that stretches across the entire chart. This line marks the value of the very first Euro trade which occurred @ $1.1740 per Euro. Based on investors’ expectations, the “fair value” of the Euro on the very first day of trading was $1.1740. As you can see from the horizontal line, the Euro has spent considerably more time above its fair value instead of below its fair value (since it began trading in 1999). What can we gather from this information? This is a clear indication that most currency traders and investors have been overly bearish on the Euro over the course of the past two decades.
There has been a never-ending chorus of negative articles concerning the Euro for the past several years, particularly since the Brexit vote was held in June 2016. Professional currency traders and Wall Street economists have been completely wrong concerning the demise of the Euro. In fact, the Euro is actually stronger today than it was prior to the Brexit vote. At least for now, there’s no reason to suspect any type of major decline in the value of the Euro. In fact, an argument could be made that the Euro will actually rally against the US Dollar during the next 12 to 24 months. Why? Because the European Central Bank is probably in the early phases of a rising interest rate cycle. In contrast, the United States is nearing the end of its interest rate cycle (probably in 2019). Therefore, the Euro will have the “wind at its back” in terms of interest rate differentials.
In regard to FXE, the long-term view is in favor of the bears. However, we must keep in mind that FXE was not launched until 2005, six years after the formation of the Euro. A chart with a longer time horizon would most likely create a neutral reading for FXE.
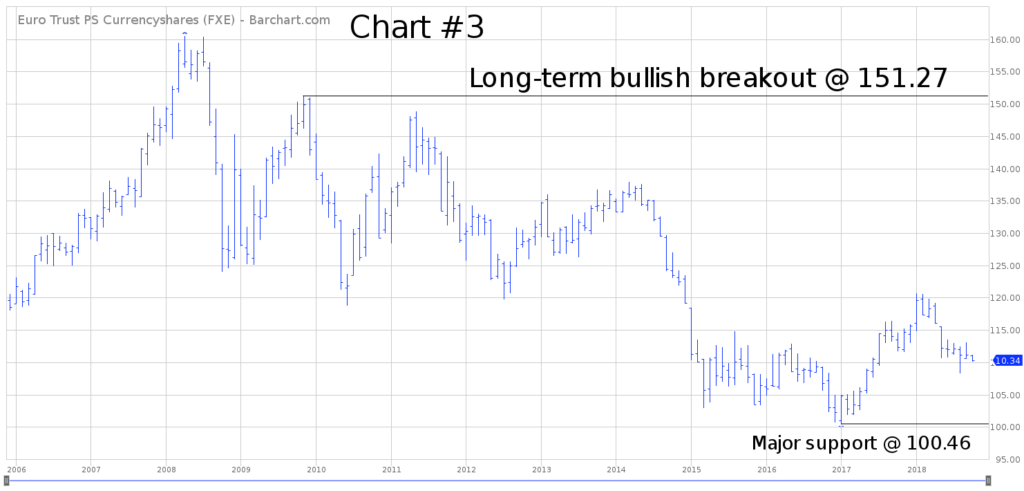
The next level of support is 100.46. In order to reverse the bearish view, FXE must produce a weekly close above 151.27. At least for now, the bears have the upper hand in regard to the long-term momentum. However, it does appear as though FXE formed an important bottom @ 100.46 in January 2017.
SHORT-TERM CHART – Euro CurrencyShares FXE
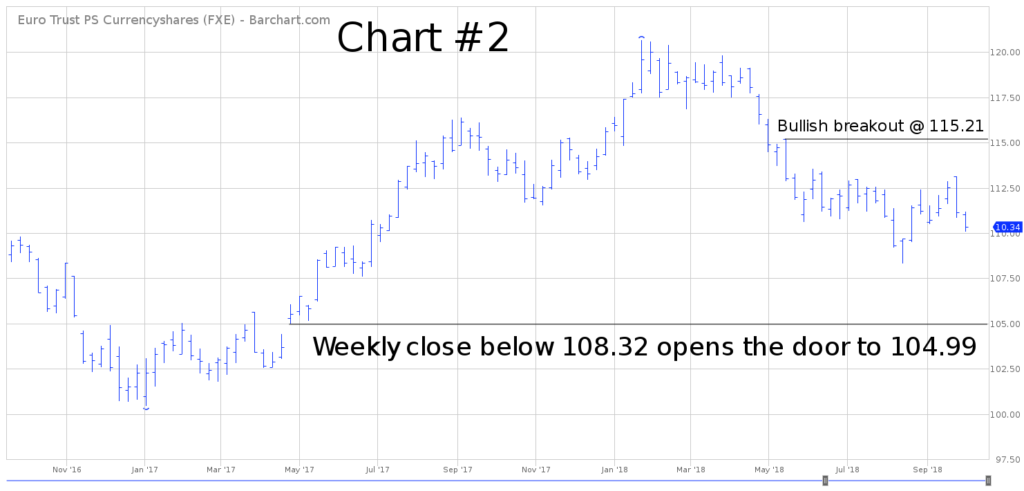
Please review the 2-year chart of FXE (Chart #2). The short-term chart pattern favors the bearish camp. In fact, a weekly close below 108.32 will turn the market decidedly bearish. FXE could easily drop to 104.99 if the bears are able to penetrate 108.32 on a weekly closing basis.
The chart pattern will turn bullish on a weekly close above 115.21.
LONG-TERM CHART – Euro CurrencyShares FXE
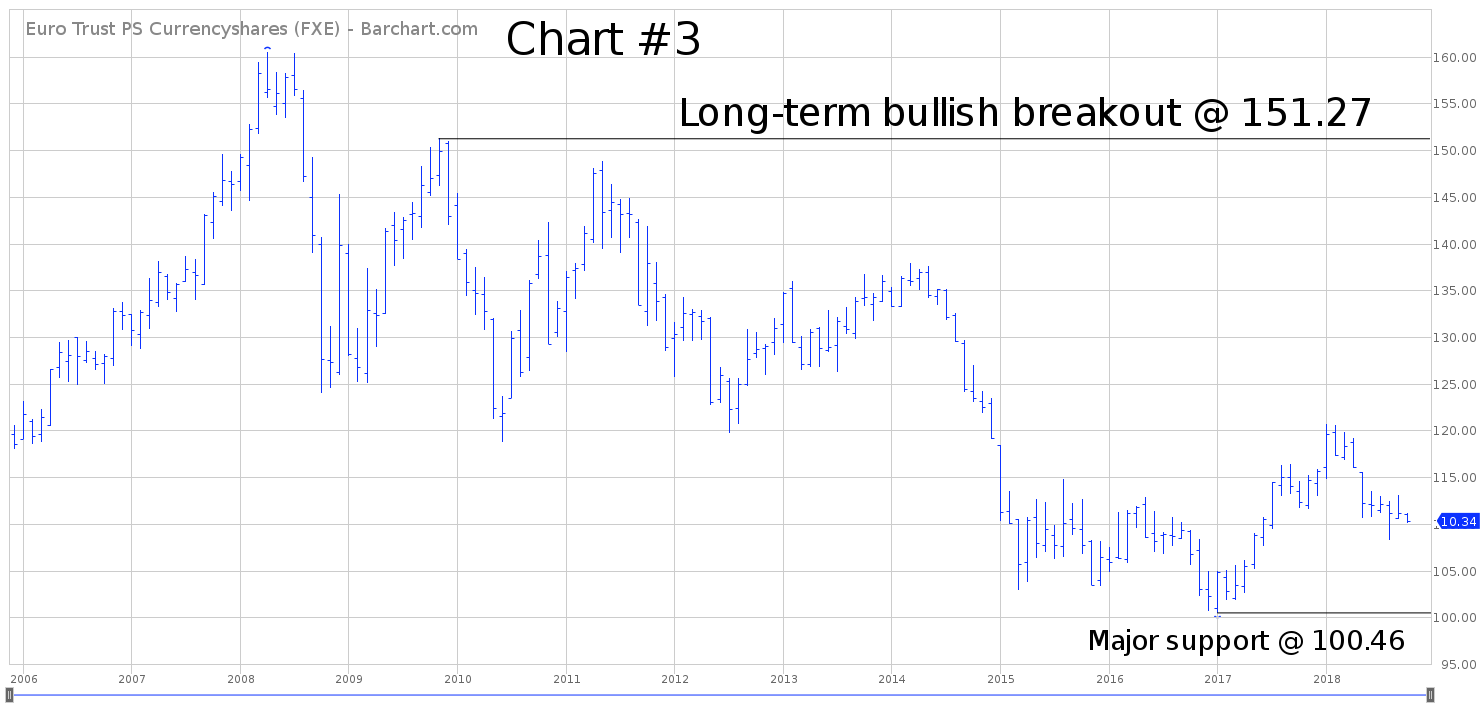
Please review the 13-year chart of FXE (Chart #3). This chart covers the entire trading history of FXE. The long-term chart pattern is bearish. The next level of support is 100.46. A weekly close above 151.27 will turn the chart pattern in favor of the bulls.


