
G-X Copper Miners ETF (COPX)
Key Statistics – COPX Copper Miners ETF
Minor Support Level 20.41 Minor Resistance Level 26.06
Major Support Level 9.46 Major Resistance Level 60.24
Minor Buy Signal 27.10 Minor Sell Signal 19.75
Major Buy Signal 62.94 Major Sell Signal 8.66
BRIEF OVERVIEW – COPX Copper Miners ETF
There are a total of 49 major commodities traded on the exchanges in the United States. These commodities are placed into eight different groups. The list includes grains, meats, metals, softs, energies, interest rates, stock indices and currencies. Which commodity is the most important in terms of influencing the global economy? Many financial experts will argue that crude oil is the most important commodity. Why? Because without energy, it would be impossible for the economy to function on a daily basis. This is certainly a valid argument. However, there is one commodity which probably does a better job at determining the future direction of the global economy. And that commodity is copper.
Historically, copper has an excellent track record of forecasting economic growth. In fact, many professional economists and Wall Street money managers refer to copper as “Dr Copper” because of its predictive ability. Copper’s forecasting capability has actually increased during the past two decades, as China has slowly exerted a greater influence on the overall growth rate of the global economy. China is, by far, the world’s largest consumer of refined copper. In 2017, the country used 48% of the world’s total copper consumption. By comparison, North America and South America combined, consumed 12%.
Several Wall Street economists and economic think tanks are forecasting a major economic slowdown within the next 12 to 18 months. Let’s review the current state of the copper market along with the overall copper industry. Perhaps this will provide us with some insights concerning the future direction of worldwide economic growth.
The Global X family of exchange traded funds introduced the G-X Copper Miners ETF in April 2010, using the ticker symbol COPX. This ETF provides investors with access to world’s largest publicly traded copper mining companies. Specifically, the COPX portfolio consists of 33 different holdings. The top five holdings include First Quantum Minerals Ltd, OZ Minerals Ltd, Antofagasta PLC, Teck Resources Ltd and Glencore PLC.
SHORT-TERM VIEW – COPX Copper Miners ETF
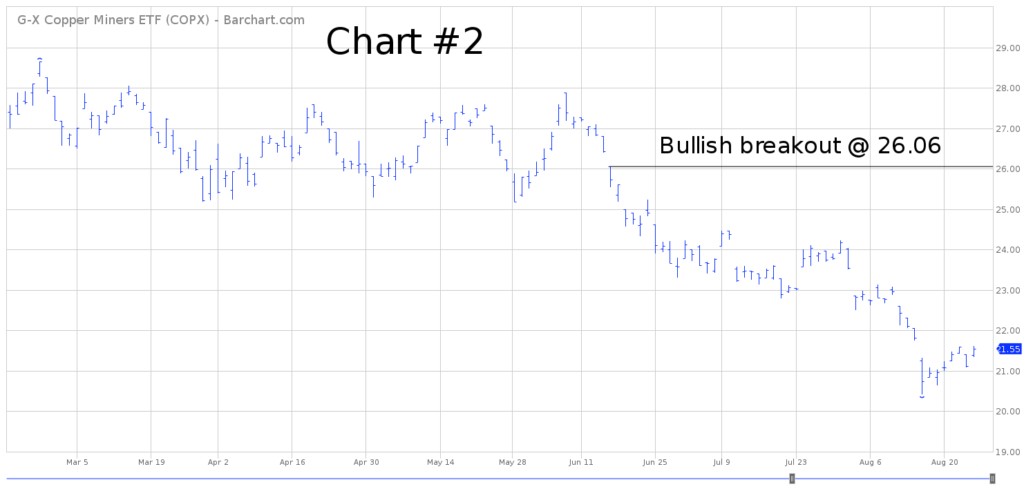
From a short-term perspective, COPX has been struggling to reverse the bearish momentum. The ETF has witnessed a brutal decline throughout the first eight months of 2018. COPX has lost 27% of its value since 25 January. The next level of support is 20.41. In order to recapture the momentum, the bulls need a weekly close above 26.06. At least for now, the most likely scenario is a continuation of lower prices.
Based on the Aroon Oscillator, COPX has an slightly oversold reading of -44. The Aroon Oscillator is programmed differently than most stochastic indicators. The oscillator fluctuates between -100 and +100. A reading of 0 would indicate a neutral position. Therefore, a reading of -44 with COPX is considered moderately oversold. Most likely, the ETF will generate a small bounce during the next few weeks.
LONG-TERM VIEW – COPX Copper Miners ETF
During the past two decades, the global demand for copper has exploded. The majority of this demand has originated from China, as the country has transitioned itself into a major player on the global economic stage. As we mentioned previously, copper has become the second most important industrial commodity in today’s global economy. In addition to China, several countries have initiated multi-year construction projects in an effort to expand their output of goods and services. These countries include Argentina, Brazil, India, Mexico, Turkey, Venezuela and Vietnam. It would be impossible to undertake these projects without copper.
During the past decade, there has been a growing concern among industry experts about the possibility of experiencing major copper shortages within the next 20 to 30 years. The idea of “peak copper” has recently received a great deal of discussion among leaders within the copper industry. Many of us have heard of “peak oil.” However, peak copper is a relatively new phenomenon. Essentially, peak copper is the point in time when the maximum extraction of copper is reached and the market enters a period of terminal decline. The entire theory of peak copper is based on the observed rise, peak, fall and depletion of aggregate production rates in copper mines over time.
Peak copper is often confused with copper depletion. Although both terms are related, they should not be used interchangeably. Copper depletion refers to a period of falling reserves and
supply. Peak copper, on the other hand, is the point immediately before the occurrence of copper depletion.
Is peak copper a real threat to the global economy or is it simply a “buzzword” used to create unnecessary concern within the copper industry? Let’s examine the facts. Please review the following table.
Copper Production
2002 – 2019
Year Production Year Production
2002 13,600 (*) 2003 13,800
2004 14,700 2005 15,000
2006 15,100 2007 15,500
2008 15,600 2009 16,100
2010 16,100 2011 16,100
2012 16,900 2013 18,200
2014 18,400 2015 19,100
2016 20,160 2017 19,700
2018 21,000 (est) 2019 21,800 (est)
(*) Thousand metric tons
Source US Geological Survey
As you can see from the table, world copper production has steadily increased during the past 15 years. However, has the increased production been large enough to meet the growing demand? Please review the following table.
Copper Production and Usage
2017 – 2019
Year Production Usage Shortfall
2017 19,700 (*) 23,800 (4,100)
2018 (est) 21,000 24,500 (3,500)
2019 (est) 21,800 25,000 (3,200)
(*) Thousand metric tons
Source International Copper Study Group
In 2017, world copper usage outpaced production by 4,100 thousand metric tons. The shortfall is projected to continue for the next two years. Of course, two years of global copper shortage certainly does not imply that peak copper is on the verge of destroying the global economy. However, it does mean that world copper supplies are incredibly tight (and probably will remain tight well into the next decade).
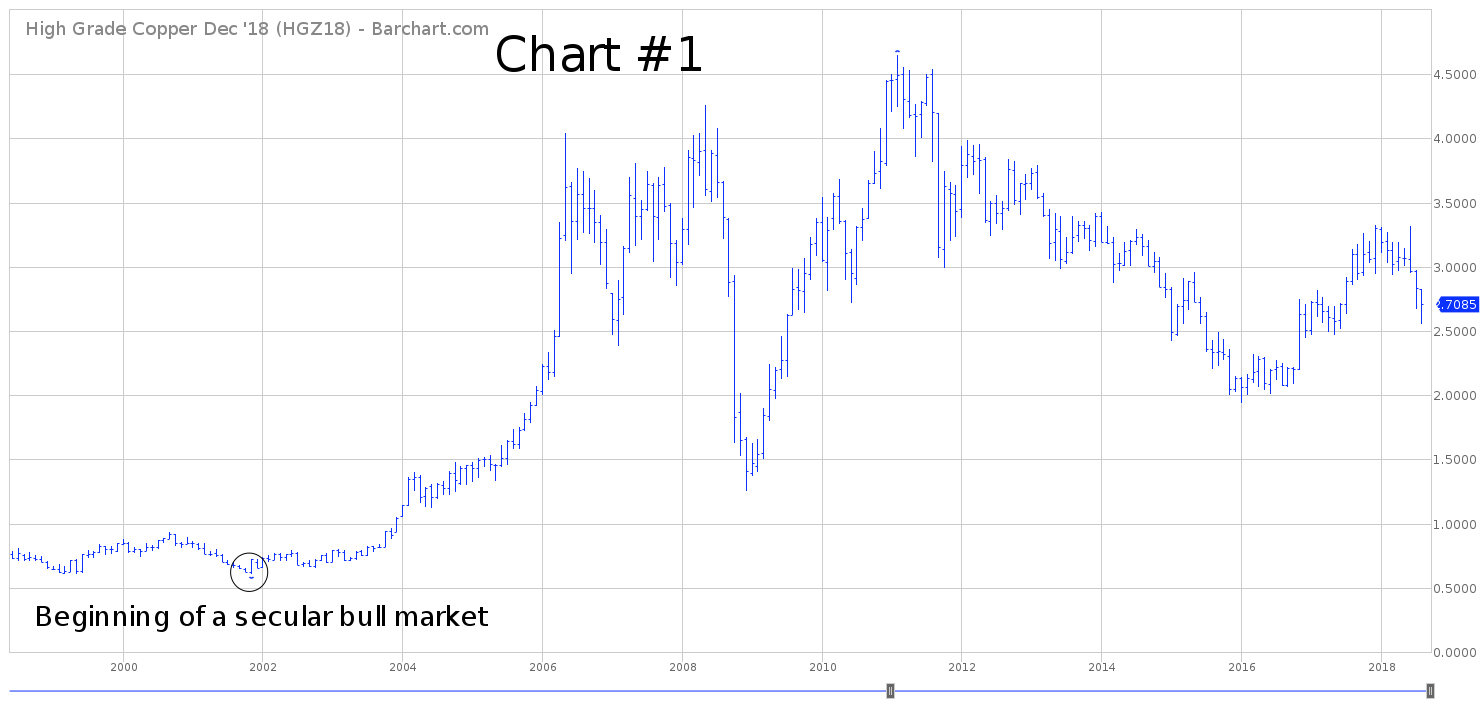
Next, let’s review a 20-year chart of copper (Chart #1). What type of information can we glean from this picture? Based on the current chart pattern, it certainly appears that copper is in the midst of a secular bull market, which began in November 2001. The true breakout occurred in October 2003. Typically, a secular bull market will last 25 to 30 years. Therefore, we can expect copper to reach its final peak near 2030.
Without question, copper formed an important top in February 2011 @ 4.6495. However, this was not a long-term (secular) top. Instead, 4.6495 marked a cyclical top. Eventually, copper will generate a new all-time high. Most likely, this will occur during the next 24 to 36 months.
If copper does indeed form a new all-time within the next few years, this is a strong indication that the global economy will continue to expand as far as the eye can see. The “doom and gloom” crowd will continue to be wrong. The future looks bright.
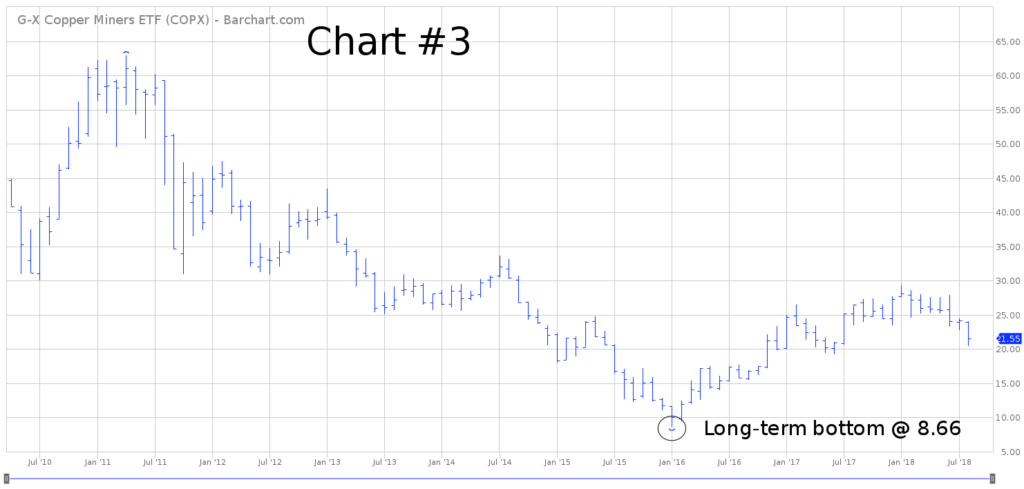
In regard to COPX, the long-term momentum is in favor of the bears. However, we must remember that COPX has only been in existence for eight years. Therefore, it’s rather difficult to draw any long-term conclusions based on eight years of data. Nevertheless, the bears are in control of the long-term momentum until COPX generates a weekly close above 60.24.
SHORT-TERM CHART – COPX Copper Miners ETF
Please review the attached 6-month chart of COPX (Chart #2). The ETF has been drifting lower throughout all of 2018. At this point, there’s no reason to expect any type of bullish reversal. At the very least, the bulls need a weekly close above 26.06 in order to recapture the momentum.
LONG-TERM CHART – COPX Copper Miners ETF
Please review the attached 8-year chart of COPX (Chart #3). This chart covers the entire trading history of the ETF. Unfortunately for COPX shareholders, the ETF was launched about 12 months before the peak in copper prices in April 2011. Consequently, COPX has been struggling to generate a sustainable rally for the past seven years. However, it does appear that COPX recorded an important bottom in January 2016 @ 8.66.
The long-term trend will turn bullish on a weekly close above 60.24. Obviously, it would take an incredibly bullish move in the price of copper to push COPX above 60.24. However, based on the current trend in the global economy, a long-term rally in copper is certainly feasible.


